|
Clear telegraphing by Federal Reserve officials, who have repeated and repeated the need to keep up the fight against inflation, points to no policy headlines at Wednesday’s FOMC announcement and press conference. Yet outcomes in the latest week weren’t entirely expected including noticeable change and divergence in several purchasing manager reports, a sudden drop in Tokyo consumer prices, and complete lack of progress for the US PCE price indexes.
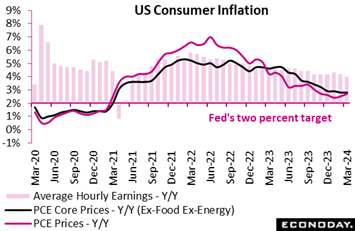 The PCE indexes are what the Federal Reserve most closely track and are the last word on US inflation. And there’s no ambiguity that progress is lacking. April’s PCE deflator rose 0.3 percent on the month in March, as expected, the same pace as the previous month. On the year, the index edged higher – not lower – to 2.7 percent which was above Econoday’s consensus and February's 2.5 percent reading. The ex-food ex-energy core came in at 2.8 percent, also above the consensus and showing no change from February. The PCE indexes are what the Federal Reserve most closely track and are the last word on US inflation. And there’s no ambiguity that progress is lacking. April’s PCE deflator rose 0.3 percent on the month in March, as expected, the same pace as the previous month. On the year, the index edged higher – not lower – to 2.7 percent which was above Econoday’s consensus and February's 2.5 percent reading. The ex-food ex-energy core came in at 2.8 percent, also above the consensus and showing no change from February.
This is not good news for the Fed and will have Jerome Powell looking glum. Another disappointment for everyone is the year-ahead inflation reading from the University of Michigan which jumped to 3.2 percent in April from March’s 2.9 percent. This is the highest reading since November last year and suggests that consumers are reading the business news, that is how strong the labor market and consumer demand continue to be. They’re also reading the handwriting on the wall when it comes to Fed policy.
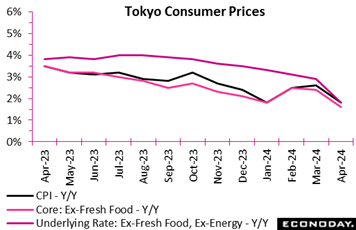 Consumer inflation in Tokyo, the leading indicator of the national average, decelerated much faster than expected in April as completely free high school education took effect in the Tokyo Metropolitan area this month and gains in processed food and hotel fees continued easing. Consumer inflation in Tokyo, the leading indicator of the national average, decelerated much faster than expected in April as completely free high school education took effect in the Tokyo Metropolitan area this month and gains in processed food and hotel fees continued easing.
The core CPI (excluding fresh food) posted a 1.6 percent gain on year, well below the median forecast of 2.2 percent. Yet even without the price-cutting tuition effect, the core reading would still have come in below expectations at 2.1 percent and well below March’s 2.4 percent.
The year-over-year rise in the total CPI slowed to 1.8 percent from 2.6 percent in March and 2.5 percent in February. Excluding the impact of the tuition, the overall CPI would have gained 2.3 percent which would still have missed expectations for 2.6 percent. The core-core CPI (excluding fresh food and energy) moderated sharply to a 19-month low of 1.8 percent from 2.9 percent, much lower than the consensus forecast of 2.7 percent.
The national government has been providing subsides to slash high school tuition fees but the Tokyo prefectural government added its own financial support, removing the upper limit on household income from eligibility conditions and effectively making all public and private tuition free for grade 10 to 12 students.
Yet cooling pressures are evident elsewhere. Prices of services excluding owners' equivalent rent slowed to 1.0 percent on the year in April from 2.9 percent in March. The annual rate of goods prices excluding fresh food rose 2.5 percent after rising 3.0 percent the previous month.
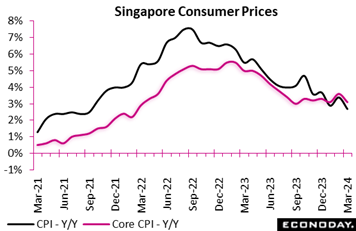 Singapore's headline consumer price index rose 2.7 percent on the year in March, slowing sharply from 3.4 percent in February. The index fell 0.1 percent on the month after advancing 1.0 percent previously. The Monetary Authority of Singapore's preferred measure of core inflation, which excludes the cost of accommodation and private road transport, fell from 3.6 percent in February to 3.1 percent in March. This index fell 0.2 percent on the month after an increase of 0.5 percent previously. Singapore's headline consumer price index rose 2.7 percent on the year in March, slowing sharply from 3.4 percent in February. The index fell 0.1 percent on the month after advancing 1.0 percent previously. The Monetary Authority of Singapore's preferred measure of core inflation, which excludes the cost of accommodation and private road transport, fell from 3.6 percent in February to 3.1 percent in March. This index fell 0.2 percent on the month after an increase of 0.5 percent previously.
Lower core inflation in March was broad-based. Food prices rose 3.0 percent on the year after an increase of 3.8 percent previously, while the year-over-year increase in services prices slowed from 4.2 percent to 3.9 percent. Prices for retail and other goods and electricity and gas prices also rose at a more moderate pace. The year-over-year increase in private transport prices weakened sharply, falling 0.3 percent on the year after a previous increase of 1.4 percent.
Officials at the MAS retained their target for appreciation of Singapore's exchange rate at their last quarterly meeting earlier this month, and officials again expressed confidence that this appreciation will curb imported inflation over the rest of the year. An easing in labour market tightness is also expected to reduce pressure on domestic prices. The next quarterly policy meeting for the MAS is scheduled to take place mid-July.
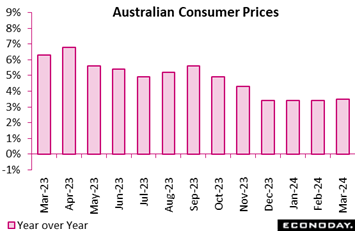 Monthly CPI data show that headline inflation in Australia rose slightly to 3.5 percent in March from 3.4 percent in February, matching the consensus forecast. Headline inflation has now been steady for four months, holding above the Reserve Bank of Australia's target range of two percent to three percent. Monthly CPI data show that headline inflation in Australia rose slightly to 3.5 percent in March from 3.4 percent in February, matching the consensus forecast. Headline inflation has now been steady for four months, holding above the Reserve Bank of Australia's target range of two percent to three percent.
The steady results reflected offsetting moves across major categories. Food prices rose 3.5 percent on the year in March after advancing 3.6 percent in February, with communication prices also increasing at a slightly slower pace. Housing costs rose 5.2 percent after a previous increase of 4.6 percent, while the year-over-year increase in fuel prices accelerated from 4.1 percent to 8.1 percent.
March's data also show slightly stronger underlying pressures. Excluding volatile items – including fuel and holiday travel – prices rose from 3.9 percent in February to 4.1 percent in March, while the monthly trimmed mean measure rose from 3.9 percent to 4.0 percent. On a quarterly basis, consumer prices rose 1.0 percent compared to the fourth quarter which was up from 0.6 percent from the fourth quarter to the third quarter.
At the RBA's March meeting officials highlighted uncertainties impacting the inflation outlook and again reiterated that returning inflation to target remains their highest priority. Given uncomfortably strong pressures through most of the latest data, a cut in policy rates remains unlikely in upcoming meetings.
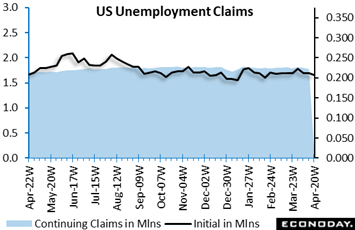 Initial jobless claims fell 5,000 to 207,000 in the April 20 week for the lowest level since mid-February. The four-week moving average fell 1,250 to 213,250 in the April 20 week. Applications for jobless benefits remain low, fairly stable, and consistent with a tight labor market and expectations for another solid month for nonfarm payroll growth (see Looking Ahead for details). Initial jobless claims fell 5,000 to 207,000 in the April 20 week for the lowest level since mid-February. The four-week moving average fell 1,250 to 213,250 in the April 20 week. Applications for jobless benefits remain low, fairly stable, and consistent with a tight labor market and expectations for another solid month for nonfarm payroll growth (see Looking Ahead for details).
The level of insured jobless claims fell 15,000 to 1.781 million in the April 13 week with this four-week moving average down 7,250 to 1.794 million. Among those eligible for unemployment benefits, the number of persons receiving payments also remains relatively low and stable, and also consistent with a tight labor market. The insured rate of unemployment has held unchanged at 1.2 percent for more than a year.
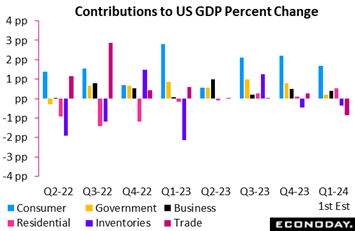 US GDP did come in lower than expected but due not to demand or to investment, rather to net exports and inventories. GDP rose 1.6 percent at an annualized in the quarter, below the consensus expectation of 2.3 percent in Econoday’s survey. This was the weakest showing since 0.6 percent contraction in second-quarter 2022. US GDP did come in lower than expected but due not to demand or to investment, rather to net exports and inventories. GDP rose 1.6 percent at an annualized in the quarter, below the consensus expectation of 2.3 percent in Econoday’s survey. This was the weakest showing since 0.6 percent contraction in second-quarter 2022.
Personal consumption expenditures did slow more than expected, to a 2.5 percent rate after 3.3 percent the previous quarter but not too far outside expectations for 2.8 percent. While PCE remained the main contributor, adding 1.68 percentage points to GDP, the contribution declined from 2.20 the previous quarter. The contribution came from services (1.78 percentage points, led by household consumption), which were up 4.0 percent in the first quarter after 3.4 percent the previous period, while spending on goods contracted 0.4 percent, trimming GDP by 0.09 percentage point. Spending on durable goods fell 1.2 percent while it was flat for nondurable goods.
A 3.2 percent expansion in gross investment, up from 0.7 percent in the fourth quarter of 2023, also contributed to GDP, adding 0.56 percentage points. Fixed investment increased 5.3 percent after 3.5 percent. Residential investment was particularly solid, with a 13.9 percent advance, the largest gain since the fourth quarter 2020. Nonresidential investment also rose, up 2.9 percent in the first quarter.
On the downside, net exports of goods and services trimmed GDP by 0.86 percentage points after adding 0.25 the previous quarter. The decline reflects less foreign demand but also still strong domestic consumption of foreign goods and services in what is another positive indication for demand. The change in private inventories shed 0.35 percent points after a negative 0.47 point contribution in the fourth quarter of 2023 indicating, relative to demand, the need to rebuild inventories in what could be a positive factor for second-quarter GDP.
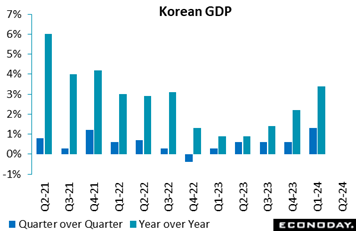 Driven by domestic demand, South Korean GDP picked up to 1.3 percent sequential growth in the first quarter, up sharply from growth of 0.6 percent in the fourth quarter, with year-over-year growth picking up from 2.2 percent to 3.4 percent. Private consumption rose 1.3 percent on the quarter, accelerating from growth of 0.3 percent previously, while investment rebounded sharply, up 1.5 percent after a previous fall of 1.4 percent. Government consumption also rose at a slightly stronger pace. Exports and imports, however, both weakened. Driven by domestic demand, South Korean GDP picked up to 1.3 percent sequential growth in the first quarter, up sharply from growth of 0.6 percent in the fourth quarter, with year-over-year growth picking up from 2.2 percent to 3.4 percent. Private consumption rose 1.3 percent on the quarter, accelerating from growth of 0.3 percent previously, while investment rebounded sharply, up 1.5 percent after a previous fall of 1.4 percent. Government consumption also rose at a slightly stronger pace. Exports and imports, however, both weakened.
At their most recent policy meeting earlier this month, officials at the Bank of Korea left policy rates on hold at 3.50 percent, as they have since the start of 2023. This decision reflected officials' assessment that core inflation will "continue its slowing trend". Officials also expect further improvement in economic growth, supported by stronger external demand.
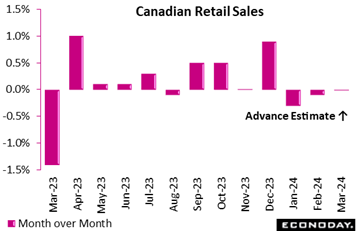 Retail sales in Canada proved weaker than expected in February, when they retreated a further 0.1 percent following 0.3 percent contraction in January. The advance estimate for March points to flat sales. February’s volumes, more relevant to real GDP, were down 0.3 percent on the month. Retail sales in Canada proved weaker than expected in February, when they retreated a further 0.1 percent following 0.3 percent contraction in January. The advance estimate for March points to flat sales. February’s volumes, more relevant to real GDP, were down 0.3 percent on the month.
As the Bank of Canada continues to monitor the balance of supply and demand in the economy, which it said moved into excess supply in the second half of 2023, the latest data strengthen the case for considering lowering the policy rate.
February’s details were no better than mixed, with five of nine sectors recording lower sales, led by a 2.2 percent drop in gasoline and fuel (the decrease was 3.9 percent in volume). Housing-related sales also declined over the month: building materials and garden equipment were down 0.4 percent and furniture, home furnishings, electronics and appliances contracted 1.5 percent. Clothing and accessories fell 1.0 percent and sporting goods and miscellaneous were down 0.2 percent.
On the upside, motor vehicles and parts increased 0.5 percent. Excluding this sector, sales would have been down 0.3 percent instead of 0.1 percent. But with gasoline and fuel up, core sales excluding the two categories were flat.
Regionally, sales declines were broad based across seven provinces, led by Alberta. Sales increased 1.2 percent year-over-year.
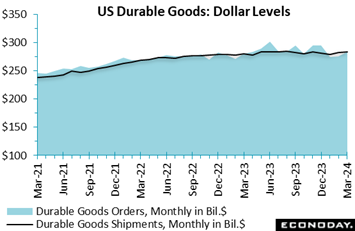 Production is one area of the US economy that may or may not be moving. New orders for durable goods in March rose 2.6 percent on the month on top of a 0.7 percent gain in February. The March increase was a bit better than expectations and largely attributable to a 7.7 percent jump in transportation where orders for nondefense aircraft rose 30.6 percent with nondefense aircraft up 2.8 percent. Motor vehicle orders were also a strong positive in March, up 2.1 percent. The spikes higher in the blue area of the accompanying graph reflect spikes in aircraft orders and contrast with the steady black line for total shipments. Production is one area of the US economy that may or may not be moving. New orders for durable goods in March rose 2.6 percent on the month on top of a 0.7 percent gain in February. The March increase was a bit better than expectations and largely attributable to a 7.7 percent jump in transportation where orders for nondefense aircraft rose 30.6 percent with nondefense aircraft up 2.8 percent. Motor vehicle orders were also a strong positive in March, up 2.1 percent. The spikes higher in the blue area of the accompanying graph reflect spikes in aircraft orders and contrast with the steady black line for total shipments.
Orders excluding transportation managed only a 0.2 percent in March after a 0.1 percent increase in February. Except for transportation, new orders were mixed with few large movements. Overall orders appear stalled. The so-called core measure – new orders less nondefense capital goods excluding aircraft – rose only 0.2 percent in March after up 0.4 percent in February.
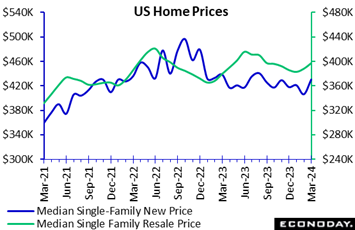 Sales of new US single-family homes rose 8.8 percent in March to 693,000, above Econoday’s consensus of 670,000. Demand for new single-family homes remains active despite higher prices and elevated mortgage rates due to the limited supply of resales on the market. However, prices and rates are nevertheless restraining sales as some potential homebuyers are priced out of the market or have delayed purchasing waiting for mortgage rates to decline. Sales of new US single-family homes rose 8.8 percent in March to 693,000, above Econoday’s consensus of 670,000. Demand for new single-family homes remains active despite higher prices and elevated mortgage rates due to the limited supply of resales on the market. However, prices and rates are nevertheless restraining sales as some potential homebuyers are priced out of the market or have delayed purchasing waiting for mortgage rates to decline.
The median price of a new single-family home rose 6.0 percent in March to $430,700 from $406,500 in February but was down 1.9 percent from $438,900 a year ago. This contrast is due to competition for homes in the lower price ranges, which is raising prices in the near term, but is comparatively below last year when sales were more in the higher price ranges. The supply of new homes available for sale is at 8.3 months, down from 8.8 months in February but slightly more than 8.1 months in March 2023.
Homebuyers in the March market were using mortgages mostly taken out in February. The Freddie Mac average rate for a 30-year fixed rate mortgage was 6.64 percent in January, rose to 6.81 percent in February and was little changed at 6.82 percent in March. At these high rates, homebuyers are less likely to act quickly and take out contracts before the unit is started. The share of homes sold for units not yet started was 12 percent in March, down from 13 percent in February and 15 percent in March 2023. The share of homes under construction sold was 41 percent, down from 43 percent in February and 44 percent in March 2023. The share of homes sold that were complete was 47 percent in March after 43 percent in February and 41 percent a year ago.
Note that the contract rate for a 30-year mortgages in the latest week was 7.24 percent as tracked by the Mortgage Bankers Association. This is 11 basis points higher than the prior week, 31 basis points higher than four weeks ago, and 69 basis points higher than a year earlier.
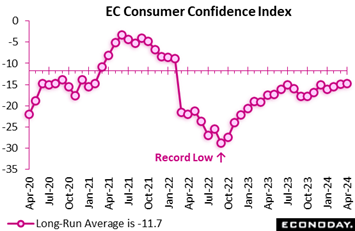 European consumer confidence improved again in April but not by much and by less than expected. At minus 14.7, the EU Commission's provisional index stood just 0.2 points above March but 0.4 points below the consensus. This is its third straight gain and makes for the strongest reading since February 2022 but the gauge remains some way short of its minus 11.7 long-run average. April's modest rise leaves intact a slowly improving trend in sentiment but current levels still suggest no significant near-term bounce for household spending. European consumer confidence improved again in April but not by much and by less than expected. At minus 14.7, the EU Commission's provisional index stood just 0.2 points above March but 0.4 points below the consensus. This is its third straight gain and makes for the strongest reading since February 2022 but the gauge remains some way short of its minus 11.7 long-run average. April's modest rise leaves intact a slowly improving trend in sentiment but current levels still suggest no significant near-term bounce for household spending.
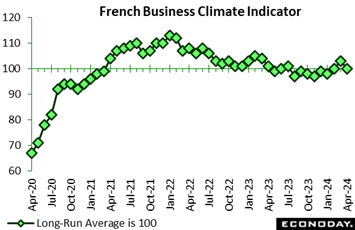 Sentiment in French manufacturing unexpectedly deteriorated in April. At 100, the headline index was 3 points below March and well short of the market consensus. The latest outturn matched its long-run average. Sentiment in French manufacturing unexpectedly deteriorated in April. At 100, the headline index was 3 points below March and well short of the market consensus. The latest outturn matched its long-run average.
Production (0 percent after 1 percent) stalled and future prospects were dented by a steeper fall in order books (minus 19 percent after minus 14 percent). General production expectations (minus 7 percent) were unchanged while personal production expectations (9 percent after 10 percent) edged a little weaker.
Elsewhere, sentiment also worsened in both services (100 after 103) and construction (101 after 103) but improved in retail trade (103 after 100). As a result, the economy-wide gauge dipped a point and, at 99, moved back below its historic norm.
April’s surprisingly soft results contrast with April's flash PMI which found the economy picking up some momentum on the back of a stronger services sector. However, both reports show manufacturing still struggling to climb out of its downturn.
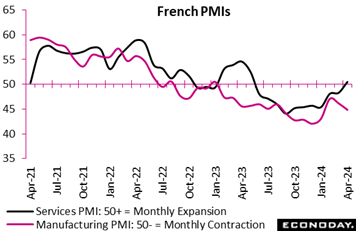 Private sector business activity in France essentially stagnated in April. At 49.9, the flash composite output index was just 0.1 point short of the 50-expansion threshold but more than a full point above the market consensus. It was also up from March's final 48.3 and an 11-month high. Private sector business activity in France essentially stagnated in April. At 49.9, the flash composite output index was just 0.1 point short of the 50-expansion threshold but more than a full point above the market consensus. It was also up from March's final 48.3 and an 11-month high.
However, the improvement was far from well-balanced. While the flash services PMI climbed from the previous month's final 48.3 to 50.5, signaling the first increase in output since May 2023, its manufacturing counterpart fell from 46.2 to 44.9, a 3-month low and deep in contraction territory.
Aggregate demand continued to shrink with an increase in services more than offset by another decline in manufacturing. Backlogs followed suit and what was one of the largest rises in overall employment since the middle of last year was similarly wholly attributable to services. Business expectations about the year ahead deteriorated in both sectors and in manufacturing turned pessimistic for the first time in three months.
Not helping matters, inflation moved in the wrong direction. Input costs saw their highest rate in five months while output prices posted a 3-month peak.
In sum, the April results are very mixed. For the ECB, the main focus will be the relative buoyancy of services and increased inflationary pressures. A June cut in interest rates remains likely but a rapid ease thereafter now looks less probable.
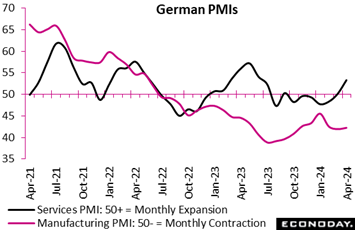 The flash composite output index was significantly stronger than expected and points to the first increase in German business activity in 10 months. At 50.5, the latest reading was nearly 2 points above the market consensus and almost 3 points clear of March's final 47.7. The flash composite output index was significantly stronger than expected and points to the first increase in German business activity in 10 months. At 50.5, the latest reading was nearly 2 points above the market consensus and almost 3 points clear of March's final 47.7.
However, in line with its French neighbor, it was services doing all the work. The flash sector PMI weighed in at a solid 53.3, up from March's final 50.1 and also a 10-month high. By contrast, at a lowly 42.2 its manufacturing counterpart remained in the doldrums and indicative of a deep and ongoing contraction. The output sub-index stood at 45.0.
Aggregate new orders fell again as a steep drop in manufacturing more than eclipsed a rise in services. Much the same pattern applied to backlogs and a modest gain in total employment was similarly restricted by weakness in goods producing. Still manufacturers' business expectations about the year ahead improved to their best level in a year whereas confidence in services eased from March's 25-month high.
Overall input cost inflation ticked up from March's 3-month low, mainly reflecting increased wage pressures in services. Output price inflation also moved off the previous period's 37-month low as rises in services just more than offset another steep fall in manufacturing.
Much like France, April's update paints a very lopsided picture of German economic growth. In itself, this is not good news for the sustainability of the recovery though for the ECB, it will be developments in services that cause the most concern. Stronger activity seems to be supporting increased inflationary pressure, a point that will not be wasted on the Governing Council's hawks.
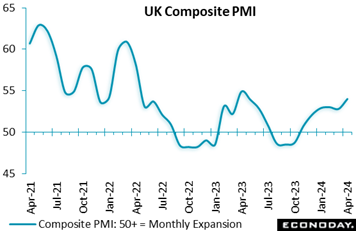 The UK looks to have made a respectable and surprisingly solid start to the second quarter. At 54.0, the flash composite output index was well above the 50-expansion threshold and a full point stronger than the market consensus. It was also its best reading in 11 months. The UK looks to have made a respectable and surprisingly solid start to the second quarter. At 54.0, the flash composite output index was well above the 50-expansion threshold and a full point stronger than the market consensus. It was also its best reading in 11 months.
However, in line with much of the rest of Europe, growth remains restricted to services. Here, the flash sector PMI weighed in at a healthy 54.9, up from a final 53.1 in March and similarly an 11-month peak. By contrast, its manufacturing counterpart fell from 50.3 to 48.7, back in contraction territory albeit only a 2-month low. The output sub-index was 49.1.
Despite a drop in manufacturing, aggregate new orders increased for a fifth straight month and by the most since May 2023 courtesy of buoyant demand in services. Overall employment also saw its strongest gain in nine months even though some firms reported a shortage of available workers being a limiting factor. Business expectations for the year were upbeat and more optimistic than at any time in 2023. That said, confidence in manufacturing deteriorated to its lowest level so far this year.
Of note, input cost inflation accelerated sharply, reaching its highest rate in 11 months on the back of building pressures in services. Stronger wage growth was a key factor. However, output price inflation still fell to its lowest mark since February 2021 as competitive market conditions limited the ability of service providers to pass on the increase in costs.
In sum, the April results should leave the majority of BoE MPC members all the more convinced that the current 5.25 percent level of Bank Rate is appropriate and that a near-term cut is not necessary.
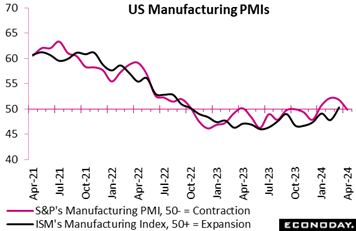 After three months over 50, S&P's manufacturing PMI sank back below this breakeven level but only fractionally at 49.9 in April. Yet the degree of the decline of 2 full points from March's 51.9 will be cooling expectations for the closely watched ISM manufacturing index which in March jumped 2.5 points to 50.3 for its first 50 score since late 2022 (see Looking Ahead for details) . After three months over 50, S&P's manufacturing PMI sank back below this breakeven level but only fractionally at 49.9 in April. Yet the degree of the decline of 2 full points from March's 51.9 will be cooling expectations for the closely watched ISM manufacturing index which in March jumped 2.5 points to 50.3 for its first 50 score since late 2022 (see Looking Ahead for details) .
S&P's services index did soften by 6 tenths to 50.9 but its run of plus-50 scores going back to early last year is still intact. Looking at these contrasting headline trends between services and manufacturing helps explain the trouble facing the Federal Reserve: in contrast to goods prices, services prices remain elevated and are slowing moderation in overall consumer prices.
Yet there are signs that manufacturing may be picking up steam of its own, whether trends earlier this year in S&P's report or March's ISM report or last week's Philadelphia Fed report for April. All these raise the question whether goods prices may begin to pick steam and pose a second threat to price stability. April input costs for S&P's manufacturing report, for example, are at a one-year high.
Nevertheless, April's aggregate flash data do point to slowing demand including the first overall reduction in new orders in six months. This resulted in the first scaling back of employment in almost four years. Business sentiment understandably dipped to a five-month low both in the manufacturing and services samples.
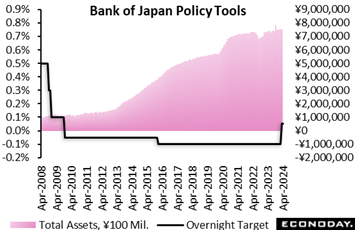 The Bank of Japan held its overnight interest rate target steady in a range of zero to 0.1 percent, as widely expected, after conducting its first rate hike in 17 years and ending the seven-year-old yield curve control framework in a 7 to 2 vote last month. The Bank of Japan held its overnight interest rate target steady in a range of zero to 0.1 percent, as widely expected, after conducting its first rate hike in 17 years and ending the seven-year-old yield curve control framework in a 7 to 2 vote last month.
In light of the highest pace of wage in more than three decades, the bank is now in the process of gradually normalizing the bank's monetary policy after 11 years of aggressive easing has apparently turned around the deflationary mindset among households and businesses. Since the short-term rate is still very low, bank officials have stressed that monetary conditions will remain accommodative for now. But Governor Kazuo Ueda has also said that if the depreciation of the yen pushes up import costs and thus inflation, "it could cause a change in monetary policy."
"Japan's economy is likely to keep growing at a pace above its potential growth rate (estimated by the bank to be 0.5 to 1.0 percent), with overseas economies growing moderately and as a virtuous cycle from income to spending gradually intensifies against the background of factors such as accommodative financial conditions," the BOJ predicted in its quarterly Outlook Report.
"With regard to the risk balance, risks to economic activity are generally balanced for fiscal 2024 onward," the bank said. "Risks to prices are skewed to the upside for fiscal 2024 but generally balanced thereafter."
For fiscal 2024 ending in March 2025, the median forecast for the year-over-year increase in the core consumer price index (excluding fresh food) is 2.8 percent, revised up from 2.4 percent in January. The core CPI rose 2.8 percent in fiscal 2023. The board's inflation projection for fiscal 2025 is 1.9 percent, revised up slightly from 1.8 percent in January, and its first estimate for fiscal 2026 is 1.9 percent, indicating inflation is expected to be anchored around the bank's two percent target.
The board's median economic growth forecast for fiscal 2024 is 0.8 percent, revised down from 1.2 percent projected about three months ago. Its GDP forecast for fiscal 2025 is unchanged at 1.0 percent. The board expects the economy to grow at 1.0 percent in fiscal 2026, its first forecast. The board forecast that GDP in fiscal 2023 grew 1.3 percent (compared to 1.8 percent projected in January), data to be included in the first-quarter GDP report to be released on May 16.
Looking ahead, the bank repeated its recent assessment that "there are extremely high uncertainties" surrounding Japan's economy including developments in overseas economic activities and prices, commodity prices as well as domestic firms' wage- and price-setting behavior. "Under these circumstances, it is necessary to pay due attention to developments in financial and foreign exchange markets and their impact on Japan's economic activity and prices.”
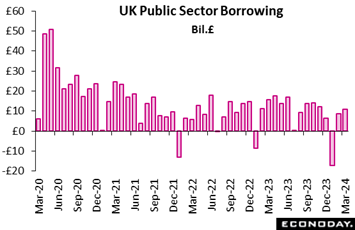 Public sector finances in the UK produced a surprisingly big £11.02 billion deficit in March, up from February's £8.60 billion but still short of the £15.71 billion posted a year ago. Excluding public sector banks (PSNB-X), the red ink stood at £11.94 billion following February's £9.52 billion and the £16.64 billion in March 2023. Public sector finances in the UK produced a surprisingly big £11.02 billion deficit in March, up from February's £8.60 billion but still short of the £15.71 billion posted a year ago. Excluding public sector banks (PSNB-X), the red ink stood at £11.94 billion following February's £9.52 billion and the £16.64 billion in March 2023.
Central government receipts rose £6.6 billion versus March 2023 courtesy of gains in income tax, corporation tax and VAT of £3.1 billion, £1.5 billion and £0.8 billion respectively. At the same time, expenditure was down £0.4 billion despite a £0.4 billion rise in interest payable on government debt. As a result, net debt was 98.3 percent of GDP, 2.6 percentage points more than at the end of March 2023 and in line with the levels last seen in the early 1960s.
The March data provisionally put the full financial year PSNB-X at £120.7 billion, some £7.6 billion less than in the previous year yet £6.6 billion more than forecast by the Office for Budgetary Responsibility. Even so, Chancellor Jeremy Hunt is still thought to be considering cuts in stamp duty and national insurance before an expected general election later this year.
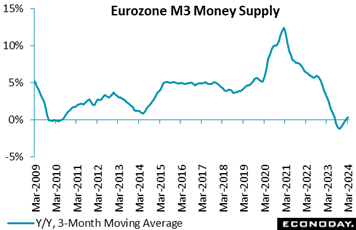 Broad money continues to gain ground in the Eurozone. A 0.3 percent monthly increase in March lifted annual M3 growth from 0.4 percent to 0.9 percent and doubled the headline 3-monthly change to 0.4 percent. The data were in line with the market consensus. Broad money continues to gain ground in the Eurozone. A 0.3 percent monthly increase in March lifted annual M3 growth from 0.4 percent to 0.9 percent and doubled the headline 3-monthly change to 0.4 percent. The data were in line with the market consensus.
The increase in the single month annual rate was again largely attributable to narrow money M1 where the yearly rate of decline eased from 7.8 percent to 6.7 percent. This was its strongest reading since April 2023. Among the M3 counterparts, private sector loans were up 0.4 percent on the year after a 0.2 percent increase previously and, after adjustment for loan sales and securitisation as well for positions due to notable cash pooling services, 0.8 percent following a 0.7 percent gain. Within the latter, adjusted loans to households slowed a little (0.2 percent after 0.3 percent) despite a pick-up in lending for consumption (2.4 percent after 2.3 percent) but borrowing by non-financial corporations (0.4 percent after 0.3 percent) continued to firm.
All in all, the March report provides further evidence that the Eurozone economy is beginning to recover from the effects of earlier ECB tightening. That will not worry the central bank unless growth accelerates quickly enough to prevent further progress towards meeting the 2 percent inflation target.
At minus 14 and minus 9, both the Relative Performance Index and the index less prices (RPI-P) extended the prior week’s pattern of global underperformance, too limited, however, to sway expectations for monetary policy.
In the Eurozone, the RPI (minus 13) and RPI-P (minus 12) remained in negative surprise territory. Economic activity looks to be recovering from earlier aggressive ECB tightening but momentum has recently slipped behind forecasts. Accordingly, an ECB interest rate cut in June remains very likely although that could still change should Tuesday’s flash inflation report for April prove surprisingly strong.
Recent UK data, though mixed, have left the economy on course to leave recession behind in the first quarter and further reduced the chances of a cut in Bank Rate as soon as the BoE’s next meeting on May 9. However, on balance, economic activity in general still disappointed and left both the RPI (minus 15) and RPI-P (minus 30) sub-zero for the first time since late-March.
In Japan, the Bank of Japan concluded with no change in interest rates, in line with market expectations and a prolonged period of generally negative surprises in the economic data. Still, the week ended with both the RPI (15) and in particular the RPI-P (66) above zero, potentially pointing to a stronger second quarter. There were no major indicators released in China, leaving this country’s RPI (minus 34) and RPI-P (minus 27) showing economic activity clearly underperforming.
In Canada, surprisingly soft retail sales kept both the RPI (minus 17) and RPI-P (minus 11) sub-zero and so support speculation that the Bank of Canada will lower its benchmark interest rate ahead of the Federal Reserve.
Economic activity in the US is coming in very near expectations, at minus 2 on the RPI and minus 6 on the RPI-P. However welcome steady strength in the labor market and consumer demand are, lack of progress on inflation keeps pushing back expectations for a Federal Reserve rate cut.
**Contributing to this article were Jeremy Hawkins, Brian Jackson, Mace News, Max Sato, and Theresa Sheehan
France will lead off Tuesday’s first estimates for first-quarter GDP followed by Germany and Italy with flat to modestly positive results the general consensus. Eurozone results will follow close behind (11:00 local time) with 0.2 percent quarterly growth the consensus. The first estimate for harmonised Eurozone inflation will be posted at the same time as Eurozone GDP with only the most marginal improvement expected.
But Tuesday’s session will actually open in China with the official CFLP PMIs, which are expected to slow, while rounding out the day will be monthly GDP from Canada, which is also expected to slow, and the quarterly employment cost index from the US which is expected to hold steady.
Wednesday’s session will center on an expected no-action Federal Reserve meeting. Monthly US employment data are another of the week’s mainliners opening with ADP on Wednesday followed on Friday by nonfarm payrolls which are expected to rise a strong 230,000.
New Zealand First-Quarter Employment (Mon 1045 NZST; Sun 2245 GMT; Sun 1845 EDT)
Consensus Forecast, Quarter over Quarter: 0.3%
Consensus Forecast, Year over Year: 1.7%
Consensus Forecast, Unemployment Rate: 4.2%
Employment is expected to rise a quarterly 0.3 percent in the first quarter following 0.4 percent expansion in the fourth quarter. The unemployment rate is expected to climb to 4.2 percent from 4.0 percent.
Eurozone: EC Economic Sentiment for April (Mon 1100 CEST; Mon 0900 GMT; Mon 0500 EDT)
Consensus Forecast: 97.1
Consensus Forecast, Industry Sentiment: -8.4
Consensus Forecast, Consumer Sentiment: -14.7
Economic sentiment in April is expected to rise to 97.1 from March’s 96.3 which remained well short of the 100 long-run average.
German CPI, Preliminary April (Mon 1400 CEST; Mon 1200 GMT; Mon 0800 EDT)
Consensus Forecast, Month over Month: 0.6%
Consensus Forecast, Year over Year: 2.3%
HICP, Preliminary April
Consensus Forecast, Year over Year: 2.3%
April’s consensus for the national CPI is a year-over-year 2.3 percent versus March’s 2.2 percent rate that was down from 2.5 percent in February and 2.9 percent in January. Consensus for the HICP is also 2.3 percent.
Japanese Industrial Production for March (Tue 0850 JST; Mon 2350 GMT; Mon 1950 EDT)
Consensus Forecast, Month over Month: 3.5%
Consensus Forecast, Year over Year: -6.6%
Japan's industrial production is forecast to rebound 3.5 percent on the month in March for the first rise in three months after unexpectedly falling a downwardly revised 0.6 percent in February and plunging 6.7 percent in January, partially recovering from the effects of suspended vehicle output over a safety test scandal.
Japanese Retail Sales for March (Tue 0850 JST; Mon 2350 GMT; Mon 1950 EDT)
Consensus Forecast, Month over Month: 0.6%
Consensus Forecast, Year over Year: 2.8%
Retail sales are expected to rise 0.6 percent on the month in March following a higher-than-expected 1.5 percent rise in February. The government maintained its assessment in the February report that retail sales were “taking one step forward and one step back”.
China: CFLP PMIs for April (Tue 0930 CST; Tue 0130 GMT; Mon 2130 EDT)
Manufacturing PMI, Consensus Forecast: 50.3
Non-manufacturing PMI, Consensus Forecast: 52.2
The CFLP manufacturing PMI is expected to ease back to 50.3 in April from March’s 50.8 which ended five straight sub-50 readings. The non-manufacturing PMI, expected at 52.2 versus March’s 53.0, has held above 50 for more than a year.
Australian Retail Sales for March (Tue 1130 AEST; Tue 0130 GMT; Mon 2130 EDT)
Consensus Forecast, Month over Month: 0.2%
Retail sales in March are expected to increase 0.2 percent on the month after February’s 0.3 percent increase that got a boost from Taylor Swift concerts. Apart from Taylor and unseasonable volatility in holiday spending, officials judged in February’s report that underlying sales growth had “stagnated".
China: S&P Manufacturing PMI for April (Tue 0945 CST; Tue 0145 GMT; Mon 2145 EDT)
Consensus Forecast: 51.0
After 51.1 in March, S&P's manufacturing PMI in April is expected to hold in plus-50 ground at 51.0 for a fifth straight month.
French First-Quarter GDP, First Estimate (Tue 0730 CEST; Tue 0530 GMT; Tue 0130 EDT)
Consensus Forecast, Quarter over Quarter: 0.2%
First-quarter GDP in France is expected to increase a quarterly 0.2 percent versus a 0.1 percent rise in the fourth quarter.
German Retail Sales for March (Tue 0800 CEST; Tue 0600 GMT; Tue 0200 EDT)
Consensus Forecast, Month over Month: 0.7%
Sales volumes are expected to rise 0.7 percent on the month in March in a partial rebound from February’s much steeper-than-expected 1.9 percent drop. Purchases have declined in each of the last four reports.
German Unemployment Rate for April (Tue 0955 CEST; Tue 0755 GMT; Tue 0355 EDT)
Consensus Forecast: 5.9%
April’s unemployment rate is expected to hold steady at March’s 5.9 percent. Germany’s jobs market has remained tight.
German First-Quarter GDP, First Estimate (Tue 1000 CEST; Tue 0800 GMT; Tue 0400 EDT)
Consensus Forecast, Quarter over Quarter: 0.1%
Consensus Forecast, Year over Year: -0.3%
The flash estimate for first-quarter GDP is marginal quarter-over-quarter expansion of 0.1 percent and year-over-year contraction of 0.3 percent. These would compare with respective fourth-quarter contraction of 0.3 and 0.2 percent.
Italian First-Quarter GDP, First Estimate (Tue 1000 CET; Tue 0900 GMT; Tue 0400 EST)
Consensus Forecast, Year over Year: 0.4%
First-quarter GDP is expected to expand 0.4 percent on the year versus 0.6 percent expansion in the fourth quarter.
Eurozone First-Quarter GDP, First Estimate (Tue 1100 CEST; Tue 0900 GMT; Tue 0500 EDT)
Consensus Forecast: Quarter over Quarter: 0.2%
Consensus Forecast, Year over Year: 0.2%
First-quarter Eurozone GDP is expected to expand a quarterly 0.2 percent for year-over-year growth of also 0.2 percent. These would compare with no quarterly change in the fourth quarter and 0.1 percent expansion on the year.
Eurozone HICP Flash for April (Tue 1100 CEST; Tue 0900 GMT; Tue 0500 EDT)
Consensus Forecast, Year over Year: 2.4%
Narrow Core
Consensus Forecast, Year over Year: 2.8%
Consensus for April’s HICP flash is 2.4 percent and 2.8 percent for the narrow core. These would compare respectively with March’s 2.4 and 2.9 percent, the former versus February’s 2.6 percent and the latter versus 3.1 percent.
Italian CPI, Preliminary for April (Tue 1100 CEST; Tue 0900 GMT; Tue 0500 EDT)
Consensus Forecast, Year over Year: 1.0%
Consumer price inflation is expected to move even lower, to a consensus 1.0 percent in April versus 1.2 percent in March.
Canadian Monthly GDP for February (Tue 0830 EDT; Tue 1230 GMT)
Consensus Forecast, Month over Month: 0.4%
After January’s stronger-than-expected 0.6 percent jump, GDP in February is expected to rise 0.4 percent.
US Consumer Confidence Index for April (Tue 1000 EDT; Tue 1400 GMT)
Consensus Forecast: 104.0
The consumer confidence index is expected to hold mostly steady in April, at a consensus 104.0 versus 104.7 in March which compared with expectations for 106.7 and February’s downward revised 104.8.
US ADP Private Payrolls for April (Wed 0815 EDT; Thu 1215 GMT)
Consensus Forecast: 175,000
Forecasters see ADP's April employment number at 175,000. This would compare with March growth in private payrolls reported by the Bureau of Labor Statistics of 232,000. ADP’s number for March was 184,000.
US: ISM Manufacturing Index for April (Wed 1000 EDT; Wed 1400 GMT)
Consensus Forecast: 50.0
The ISM manufacturing index ended a nearly year-and-a-half run of contraction in March, climbing 2.5 points to much better-than-expected 50.3. No further improvement is expected for April where the consensus is expected to come in a neutral 50.0 even.
US Federal Reserve Announcement (Wed 1800 GMT; Wed 1400 EDT)
Consensus Forecast, Policy Rate Change: 0 basis points
Consensus Forecast, Target Range: 5.25 to 5.50
Outside of a possible adjustment to balance sheet unwinding, Wednesday’s Federal Reserve announcement and press conference look to be routine, that is no policy headlines, no new guidance on rates, only repetition that more progress on inflation is needed before cuts can begin.
Korean CPI for April (Thu 0800 KST; Wed 2300 GMT; Wed 1900 EDT)
Consensus Forecast, Year over Year: %
Consumer prices in April, which in March held steady at 3.1 percent, are expected to edge marginally lower to 3.0 percent.
Australian International Trade in Goods for March (Thu 1130 AEST; Thu 0130 GMT; Wed 2130 EDT)
Consensus Forecast, Balance: A$7.4 billion
Consensus for international trade in goods in March is a surplus of A$7.4 billion versus February’s lower-than-expected A$7.3 billion surplus.
Canada Merchandise Trade Balance for March (Thu 0830 EDT; Thu 1230 GMT)
Consensus Forecast: C$1.1 billion
March’s trade balance is seen in surplus of C$1.1 billion versus February’s higher-than-expected surplus of C$1.4 billion that showed wide gains for exports.
French Industrial Production for March (Fri 0845 CEST; Fri 0645 GMT; Fri 0245 EDT)
Consensus Forecast, Month over Month: 0.6%
March production is expected to rise 0.6 percent on the month after rising a lower-than-expected 0.2 percent in February. Production in France has been flat.
Eurozone Unemployment Rate for March (Fri 1100 CEST; Fri 0900 GMT; Fri 0500 EDT)
Consensus Forecast: 6.5%
Consensus for March's unemployment rate is no change at 6.5 percent. Unemployment in the Eurozone has been running at record lows.
US Employment Situation for April (Fri 0830 EDT; Fri 1230 GMT)
Consensus Forecast: Change in Nonfarm Payrolls: 230,000
Consensus Forecast: Unemployment Rate: 3.8%
Consensus Forecast: Average Hourly Earnings M/M: 0.3%
Consensus Forecast: Average Hourly Earnings Y/Y: 4.0%
A strong 230,000 rise is the call for nonfarm payroll growth in April versus an even stronger 303,000 in March which for a fifth month in a row exceeded Econoday’s consensus and for the fourth month in a row exceeded Econoday’s consensus range. Average hourly earnings in April are expected to rise 0.3 percent on the month for a year-over-year rate of 4.0 percent; these would compare with March’s rates of 0.3 and 4.1 percent. April’s unemployment rate is expected to hold unchanged at March’s 3.8 percent.
|
