|
Policy announcements were heavy and varied in the week, led by a secular shift at the Bank of Japan and including surprise moves by the central banks of Switzerland and Taiwan, one accommodative and one restrictive. Into the mix were no changes for the US Federal Reserve and the Bank of England and also the People's Bank of China, the latter benefiting from a bounce in economic activity. The week’s economic data, in fact, beat expectations solidly to lift the Relative Performance Index for the global economy to its best level in months and which, in turn, points to more restrictive policy ahead, or at least no rush to loosen policy. But this we’ll save for the end; we begin of course with the Bank of Japan.
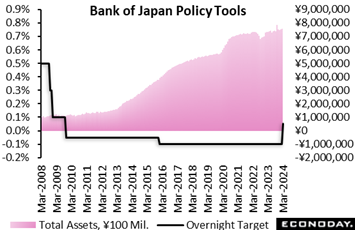 The Bank of Japan's nine-member board decided in a majority vote to end its seven-year-old yield curve control framework and lift the minus 0.1 percent overnight interest rate target to a range of zero to 0.1 percent from minus 0.1 percent, its first rate hike since February 2007. The new guideline for market operations will take effect on March 21. The Bank of Japan's nine-member board decided in a majority vote to end its seven-year-old yield curve control framework and lift the minus 0.1 percent overnight interest rate target to a range of zero to 0.1 percent from minus 0.1 percent, its first rate hike since February 2007. The new guideline for market operations will take effect on March 21.
Unlike other central banks, the BoJ is not raising rates to cool off an overheating economy or elevated consumer inflation. It is taking the first step toward unwinding massive cash injections into the financial system after nearly 11 years of trying to reflate the economy and turn around the deflationary mindset among households and businesses. Both Governor Kazuo Ueda and Deputy Governor Shinichi Uchida have said financial conditions will remain accommodative even after negative short-term interest rates are lifted.
Many board members believe that the risk of Japan's economy slipping back into deflation has been reduced and inflation is likely to be led by sustained wage hikes, instead of spikes in import costs. The move follows news in the prior week that wage hikes for fiscal 2024 beginning next month will well surpass the pace of increase seen in the previous year.
The vote on the short-term rate target was 7 to 2. Board member Toyoaki Nakamura voted against the rate hike, urging members to wait until the bank can confirm that smaller firms also have the ability to raise wages. Asahi Noguchi dissented, arguing that ending the negative rate and yield curve control at the same time could disrupt financial conditions.
The board decided to no longer target the yield on 10-year Japanese government bonds (JGBs), which had been capped at around 0.1 percent under the bank's official target of "around zero" under the yield curve control framework adopted in September 2016. It is now allowing a natural uptick in long-term interest rates that reflects economic recovery and substantial wage hikes.
The board voted 8 to 1 to continue its purchases of JGBs "with broadly the same amount as before," which is currently about ¥6 trillion per month. In case of a rapid rise in long-term rates, the bank will "make nimble responses by, for example, increasing the amount of JGB purchases and conducting fixed-rate purchases of JGBs." Board member Nakamura voted against the change in the way the bank targets long-term rates.
On the bank's large-scale asset purchases that it has been using to support market and economic sentiment, the board decided unanimously to stop new purchases of exchange-traded funds (ETFs) and Japan real estate investment trusts (J-REITS), and discontinue the purchases of commercial paper and corporate bonds in about a year by reducing them gradually.
The BoJ board also decided to drop its "inflation-overshooting commitment" under which it expanded the monetary base until the year-over-year rate of increase in the core CPI (excluding fresh food) would exceed two percent and stay above the target in a stable manner.
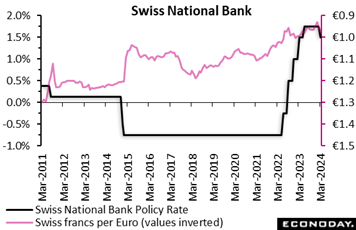 The Swiss National Bank opted to cut its policy rate by 25 basis points to 1.50 percent, a move coming ahead of most market expectations that saw the reduction being deferred until June. This is the first time that the benchmark rate has been lowered since January 2015 when the exchange rate target floor was also abandoned. In addition, the central bank indicated that it remains willing to be active in the foreign exchange markets as and when required. This suggests that it remains keen to keep the Swiss franc broadly stable. The Swiss National Bank opted to cut its policy rate by 25 basis points to 1.50 percent, a move coming ahead of most market expectations that saw the reduction being deferred until June. This is the first time that the benchmark rate has been lowered since January 2015 when the exchange rate target floor was also abandoned. In addition, the central bank indicated that it remains willing to be active in the foreign exchange markets as and when required. This suggests that it remains keen to keep the Swiss franc broadly stable.
The bank’s decision reflects the persistent and unexpected weakness of inflation with both overall and core rates having been below 2 percent since the middle of last year. Indeed, even with a policy rate of 1.5 percent, the SNB's updated economic forecasts put the overall inflation rate at just 1.1 percent in 2026. This is within the boundaries of the bank's price stability definition but, if anything, warns that policy might still be too tight. In fact, the entire forecast profile is well below the prior Monetary Policy Assessment (MPA) in December.
In terms of the real economy, growth is expected to remain modest over coming quarters. In part, this is due to expected sluggish demand from overseas together with the effects of the appreciation of the franc in real terms. GDP is forecast to grow around 1 percent this year and is thought likely to be accompanied by a gradual increase in unemployment and a further decline in capacity utilization.
The move will not come as a major surprise as speculation about a cut had been steadily building for some time. Nonetheless, the overall tone of the MPA statement is surprisingly dovish by SNB standards and suggests that another reduction in the policy rate may not be too far off.
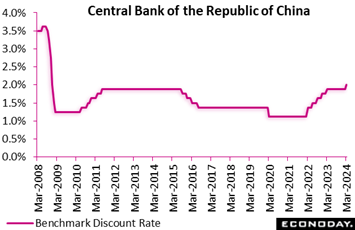 The Central Bank of the Republic of China (Taiwan) increased its main policy rate by 12.5 basis points from 1.875 percent to 2.00 percent at its quarterly policy meeting, contrary to the consensus forecast for no change. This is the first increase in the rate in twelve months and takes the rate to its highest level since 2008. The Central Bank of the Republic of China (Taiwan) increased its main policy rate by 12.5 basis points from 1.875 percent to 2.00 percent at its quarterly policy meeting, contrary to the consensus forecast for no change. This is the first increase in the rate in twelve months and takes the rate to its highest level since 2008.
In the statement. the bank expressed confidence that external demand will continue to improve in coming months, with domestic consumption and investment also expected to support stronger headline GDP growth. This positive assessment of the growth outlook has reinforced officials' focus on the inflation outlook. Although they expect inflation will trend lower this year, they expressed concerns that price pressures have remained too strong and that a proposed increase in domestic electricity prices next month could boost inflation expectations. Reflecting these concerns, officials concluded that an increase in the policy rate is required.
Data released since the CBC's previous policy meeting in December have shown volatility in headline inflation, largely reflecting the timing of lunar new year holidays. Although PMI surveys have shown ongoing contraction in the manufacturing sector, GDP growth strengthened in the fourth quarter, partly reflecting an improvement in external demand.
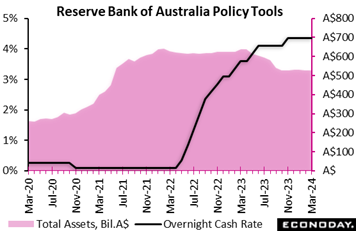 The Reserve Bank of Australia left its main policy rate, the cash rate, unchanged at 4.35 percent in line with the consensus forecast. Officials increased this rate by 25 basis points in November but have otherwise left it unchanged since mid-2023, reflecting an assessment that aggressive policy tightening over the previous twelve months will have the effect of returning inflation to within their target range of two percent to three percent. The Reserve Bank of Australia left its main policy rate, the cash rate, unchanged at 4.35 percent in line with the consensus forecast. Officials increased this rate by 25 basis points in November but have otherwise left it unchanged since mid-2023, reflecting an assessment that aggressive policy tightening over the previous twelve months will have the effect of returning inflation to within their target range of two percent to three percent.
In their statement, officials noted that "inflation continues to moderate". The most recent monthly CPI data showed headline inflation unchanged at 3.4 percent in January, down from a recent high of 5.6 percent in September 2023, with quarterly measures of headline and underlying inflation having also fallen since mid-2023. Officials still expect this downward trend to continue, forecasting inflation to return to its target range in 2025, yet the statement again highlighted uncertainties impacting the inflation outlook. Officials also noted that conditions in the labour market remain tight and that the outlook for household consumption remains uncertain.
Although officials left policy on hold, they again reiterated that returning inflation to target remains their highest priority. They concluded that "the path of interest rates that will best ensure that inflation returns to target in a reasonable timeframe remains uncertain and the Board is not ruling anything in or out". The RBA's next meeting is scheduled for early May, by which time quarterly inflation data for the current quarter will be available.
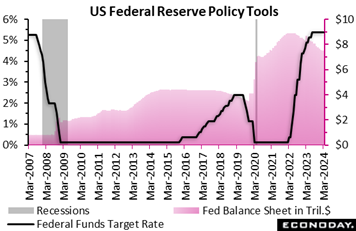 Barring "unexpected weakness in the labor market" that could trigger "a policy response", the Federal Reserve's long anticipated rate cut isn't on the immediate horizon. The latter was Jerome Powell's central message for the markets in what has become a predictable set of comments at his press conferences: the labor market remains "strong", inflation is "still too high", that continued progress on inflation "is not assured", that restrictive policy is "likely at its peak for this tightening cycle", and that the rate cut, when it likely comes, will be sometime "later this year". As expected, the FOMC made no change to the fed funds rate target at the March 19-20 deliberations and no substantive change to its policy announcement. Barring "unexpected weakness in the labor market" that could trigger "a policy response", the Federal Reserve's long anticipated rate cut isn't on the immediate horizon. The latter was Jerome Powell's central message for the markets in what has become a predictable set of comments at his press conferences: the labor market remains "strong", inflation is "still too high", that continued progress on inflation "is not assured", that restrictive policy is "likely at its peak for this tightening cycle", and that the rate cut, when it likely comes, will be sometime "later this year". As expected, the FOMC made no change to the fed funds rate target at the March 19-20 deliberations and no substantive change to its policy announcement.
The Fed’s quarterly projections lifted the longer-run expectation for the mid-point of the fed funds target rate range by a tenth to 2.6 percent after 2.5 percent which has predominated since 2.4 percent in the March 2022 forecast. It's a small move, but significant in that it is moving higher and supports slightly more restrictive monetary policy. The median forecast for the mid-point of the funds target range remained at 4.6 percent for 2024. However, the mid-point for 2025 was revised up 3 tenths to 3.9 percent and for 2026 up 2 tenths to 3.1 percent. This is a disappointment to those looking for lower rates in the next two or three years. The FOMC anticipates rates will continue to come down, but more slowly than previously forecast.
On quantitative tightening (QT), Powell said officials are beginning to discuss slowing down the reduction in the Fed’s balance sheet, not as an adjustment to policy but to limit stress on the financial markets. He said tapering the pace avoids problems where "liquidity is not evenly distributed" in the banking system. "We are looking at what would be a good time and what would be a good structure" and that changes could be coming "fairly soon". He affirmed that the longer run goal is to return to a balance sheet that is mostly US Treasuries, but added that this "not urgent right now". To date, the Fed has cut its holdings by roughly $1.5 trillion.
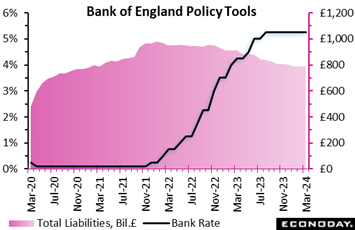 In line with February, there were no major surprises in the Bank of England’s March announcement with Bank Rate again left at the 5.25 percent level to which it was raised back in August last year. However, there was a modestly dovish shift in the voting pattern. Almost inevitably, Swati Dhingra, the main dove, repeated her call for a 25 basis point cut but the six members who again voted for no change were joined by both Jonathan Haskell and Catherine Mann who last time had called for a 25 point hike. In line with February, there were no major surprises in the Bank of England’s March announcement with Bank Rate again left at the 5.25 percent level to which it was raised back in August last year. However, there was a modestly dovish shift in the voting pattern. Almost inevitably, Swati Dhingra, the main dove, repeated her call for a 25 basis point cut but the six members who again voted for no change were joined by both Jonathan Haskell and Catherine Mann who last time had called for a 25 point hike.
The bank acknowledged that inflation in February (3.4 percent) was weaker than expected and now sees it dipping below 2 percent this quarter, mainly due to one-off factors. It also noted that most indicators of short-term inflation expectations have continued to ease. However, the bank still forecasts prices to re-accelerate over the second half of the year as key indicators of inflation persistence remain elevated, particularly in services. Members of the Monetary Policy Committee (MPC) remain suspicious about the reliability of the official labour market statistics but noted that the bank's own regional agents expect some decline in pay settlements this year and firms to have greater difficulty in passing on cost increases to prices. Even so, current wage growth remains high.
In terms of fiscal policy, the Spring Budget was thought likely to increase the level of GDP by only around 0.25 percent over coming years but since potential supply should also be raised, its implications for inflationary pressures were deemed insignificant.
Following a slightly steeper than expected drop in February’s inflation report, conditions are clearly falling into place for a cut in Bank Rate, a situation reflected in the change in this month's voting pattern. However, although current trends are favourable, there is work to do yet before either the core rate (4.5 percent) or the rate in services (6.1 percent) get close to the two percent target. A full-blown ease before June is now more possible but still looks unlikely.
Predictably, the QT tightening programme was left unamended with the MPC simply re-affirming its aim to reduce the stock of gilts held in the Asset Purchase Facility by £100 billion to £658 billion over the 12 months that began in October. In late-March, the overall stock stood at £729.9 billion, comprising just under £729.8 billion of gilts and £0.1 billion of sterling non-financial investment-grade corporate bonds.
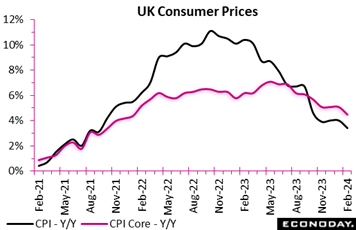 Consumer prices in the UK were again on the weak side of the consensus in February. A 0.6 percent monthly rise was a tenth less than expected and small enough to reduce the headline annual inflation rate from 4.0 percent to 3.4 percent, its weakest reading since September 2021. Accordingly, the gap with its 2 percent medium-term target has now narrowed to 1.4 percentage points. Consumer prices in the UK were again on the weak side of the consensus in February. A 0.6 percent monthly rise was a tenth less than expected and small enough to reduce the headline annual inflation rate from 4.0 percent to 3.4 percent, its weakest reading since September 2021. Accordingly, the gap with its 2 percent medium-term target has now narrowed to 1.4 percentage points.
There was also better news on core prices which similarly increased 0.6 percent versus January, again undershooting the market call. This saw the underlying yearly inflation rate ease from 5.1 percent to 4.5 percent, its lowest reading since January 2022. Overall goods inflation declined from 1.8 percent to 1.1 percent while its services counterpart decreased from 6.5 percent to 6.1 percent, a 13-month low.
The main downward contribution to the change in the annual headline rate came from restaurants and hotels where the yearly rate fell from 7.0 percent to 6.0 percent. Clothing and footwear (5.0 percent after 5.6 percent) and miscellaneous goods and services (3.6 percent after 4.5 percent) also had a useful negative effect. On the upside the main pressure came from housing and household services (minus 1.7 percent after minus 2.1 percent) and transport (minus 0.1 percent after minus 0.3 percent).
The broad-based deceleration in inflation last month went down well at the BoE. Trends are moving in the right direction but inflation in services and the core remain far too high.
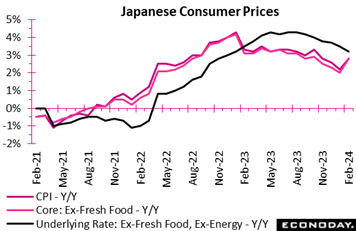 Consumer inflation in Japan accelerated in two key measures in February as the base-year effect of utility subsidies had run its course and after an influx of Asian visitors during their lunar new year holidays had pushed up hotel fees, offsetting the impact of a continued slowdown in processed food price hikes. Consumer inflation in Japan accelerated in two key measures in February as the base-year effect of utility subsidies had run its course and after an influx of Asian visitors during their lunar new year holidays had pushed up hotel fees, offsetting the impact of a continued slowdown in processed food price hikes.
The core CPI (excluding fresh food prices), closely watched by the Bank of Japan for its policy stance, rose 2.8 percent on year, touching a four-month high and coming in as expected, after easing to a 22-month low of 2.0 percent in January. The year-over-year increase in the total CPI climbed to a three-month high of 2.8 percent after moderating to a 22-month low of 2.2 percent. It was just below the median forecast of a 2.9 percent gain.
Contrasting, however, with these rates and in dissonance perhaps with the Bank of Japan’s expectations for an end to deflation, underlying inflation measured by the core-core CPI (excluding fresh food and energy) decelerated to a 13-month low of 3.2 percent from 3.5 percent, slightly below the median forecast of a 3.3 percent rise. The annual rate for this narrow indicator has been at or above 3.0 percent since December 2022.
Service costs have played catch-up in recent months as firms have been raising wages to secure workers amid widespread labor shortages. Service prices excluding owners' equivalent rent rose 3.1 percent on the year in February following a 3.2 percent rise in January.
In contrast to services, goods prices jumped last month due to a much smaller drop in utility charges. Goods prices excluding fresh food gained 3.4 percent after a 1.9 percent increase.
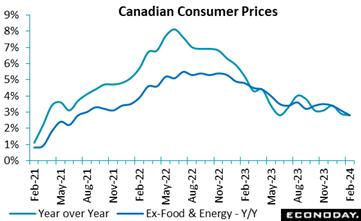 Consumer prices in Canada rose an unadjusted 0.3 percent on the month in February after being flat in January, but slowed to 2.8 percent from 2.9 percent year-over-year, both below expectations. The ex-food ex-energy core also came in below expectations, up 0.2 percent on the month and 2.8 percent on the year, the latter down from 3.1 percent in January. The Bank of Canada's own core measures of inflation likewise fell, to 3.1 percent on average from 3.3 percent in January, with all three of its measures slowing. Consumer prices in Canada rose an unadjusted 0.3 percent on the month in February after being flat in January, but slowed to 2.8 percent from 2.9 percent year-over-year, both below expectations. The ex-food ex-energy core also came in below expectations, up 0.2 percent on the month and 2.8 percent on the year, the latter down from 3.1 percent in January. The Bank of Canada's own core measures of inflation likewise fell, to 3.1 percent on average from 3.3 percent in January, with all three of its measures slowing.
With headline rates at 2.9 percent in January and 2.8 percent in February, the index is well on track to come in lower than the Bank of Canada’s 3.2 percent first-quarter projection, although the BoC reaffirmed in its March policy statement that it anticipates inflation to remain close to 3 percent in the first half of this year. In light of the BoC's own expectations, February’s update should bring relief, with both the headline and core indices within the one percent to three percent operational band.
Services prices in February rose 0.4 percent in the month and 4.2 percent year-over-year. Goods prices were up 0.3 percent and up 1.2 percent, respectively.
Food prices were flat on the month and up 3.3 percent year-over-year, and energy rose 2.8 percent and 1.3 percent, respectively. Gasoline increased 4.0 percent on the month and 0.8 percent from a year earlier.
Prices increased in four of the eight main categories on the month. Shelter continued to put upward pressure, as gains of 1.3 percent in mortgage interest cost and 0.8 percent in rent made them the third and fourth largest monthly positive contributors. Tavel tours and gasoline were the two largest contributors, while a 9.4 percent drop in internet access services was the largest downward contributor. Prices for clothing and footwear as well as household operations, furnishings and equipment, and alcoholic beverages, tobacco products and recreational cannabis decreased on the month.
On a 12-month basis, shelter was also the largest upward contributor as the mortgage interest cost was up 26.3 percent and rent 8.2 percent.
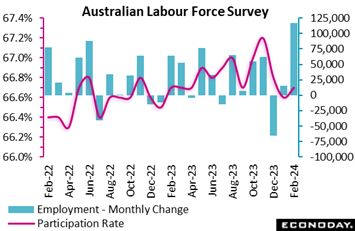 Labour market conditions in Australia strengthened sharply in February, with employment recording its biggest increase since 2021, the unemployment rate dropping to a five-month low, and the participation rate increasing slightly. Strength in labour market conditions will likely reinforce concerns about the inflation outlook at the Reserve Bank of Australia and reduce the chances of any easing in policy in the near-term. Labour market conditions in Australia strengthened sharply in February, with employment recording its biggest increase since 2021, the unemployment rate dropping to a five-month low, and the participation rate increasing slightly. Strength in labour market conditions will likely reinforce concerns about the inflation outlook at the Reserve Bank of Australia and reduce the chances of any easing in policy in the near-term.
The number of employed persons in Australia surged in February, increasing by 116,500 after a revised increase of 15,200 in January. The consensus forecast was for a much smaller increase of 30,000. Full-time employment increased by 78,200 after a previous increase of 19,900, while part-time employment rose by 38,300 after dropping by 4,600 previously. Hours worked rose sharply, up 2.8 percent on the month after dropping 2.5 percent previously.
February’s unemployment rate fell from 4.1 percent in January, its highest level in two years, to 3.7 percent in February. The participation rate rose from 66.6 percent to 66.7 percent, remaining historically high.
Officials noted that the big increase in employment recorded in February partly was driven by an unusually large number of people starting a new job after they had reported in December and January that they were not currently employed. Officials further noted that the number of people waiting to start a new job early in the year has increased sharply since before the Covid-19 pandemic, indicating that there has been a shift in seasonal patterns.
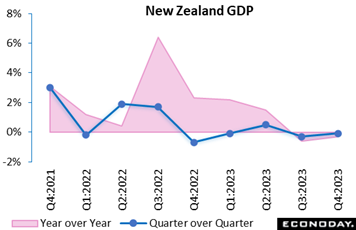 New Zealand's economy contracted in the three months to December, in line with weakness seen earlier in 2023 and suggesting that conditions may currently remain impacted by aggressive policy tightening implemented by the Reserve Bank of New Zealand over 2022 and early 2023. GDP on a quarter-over-quarter basis has now fallen, though only slightly, in four of the last five quarters. The RBNZ has left policy rates on hold since mid-2023, with officials noting at their most recent meeting last month that they are confident that current policy settings are restricting demand as part of their efforts to lower inflation. New Zealand's economy contracted in the three months to December, in line with weakness seen earlier in 2023 and suggesting that conditions may currently remain impacted by aggressive policy tightening implemented by the Reserve Bank of New Zealand over 2022 and early 2023. GDP on a quarter-over-quarter basis has now fallen, though only slightly, in four of the last five quarters. The RBNZ has left policy rates on hold since mid-2023, with officials noting at their most recent meeting last month that they are confident that current policy settings are restricting demand as part of their efforts to lower inflation.
GDP fell 0.1 percent on the quarter in the three months to December after contracting 0.3 percent in the three months to September, with the economy shrinking 0.3 percent on the year after a previous decline of 0.6 percent. The smaller quarter-over-quarter decline in headline GDP largely reflected a rebound in private consumption spending, offset by ongoing weakness in investment. On a sectoral basis, output continued to contract in the manufacturing sector, was steady but subdued in the services sector, and picked up in the primary sector.
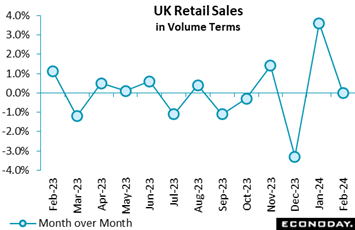 UK retail sales held up much better than expected in February. A flat monthly reading was comfortably above the consensus and followed an even stronger revised 3.6 percent bounce in January. Base effects saw annual growth slip from 0.5 percent to minus 0.4 percent but purchases stand at their highest level since last June. UK retail sales held up much better than expected in February. A flat monthly reading was comfortably above the consensus and followed an even stronger revised 3.6 percent bounce in January. Base effects saw annual growth slip from 0.5 percent to minus 0.4 percent but purchases stand at their highest level since last June.
Excluding auto fuel, the picture was slightly firmer with sales up 0.2 percent on the month, making for a 0.5 percent yearly decline.
The stable monthly performance reflected falls in the sale of food (0.3 percent) and auto fuel (1.3 percent) that just offset a rise in non-food demand (0.7 percent). Non-specialised stores (1.6 percent) and textiles and clothing (1.7 percent) had a particularly good month but household goods (minus 1.0 percent) were weak and non-store retailing only unchanged. Very wet weather may have had a negative impact.
February's update puts average total volume sales in the first two months of the quarter fully 1.7 percent above their mean level in the fourth quarter of last year. Accordingly, the sector remains on course to provide a tidy positive contribution to GDP growth.
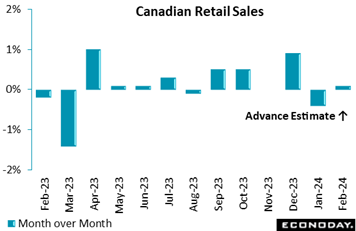 Retail sales in Canada fell slightly less than expected in January, down 0.3 percent from the previous month for a 12-month increase of 0.9 percent. The advance estimate for February points to a 0.1 percent advance. In volume terms, sales rose 0.2 percent on the month indicating that headline contraction was price related. Retail sales in Canada fell slightly less than expected in January, down 0.3 percent from the previous month for a 12-month increase of 0.9 percent. The advance estimate for February points to a 0.1 percent advance. In volume terms, sales rose 0.2 percent on the month indicating that headline contraction was price related.
January’s decline was concentrated in three of nine sectors, led by a 2.4 percent drop in motor vehicles and parts without which sales increased 0.5 percent. Food and beverage sales contracted 0.9 percent, and clothing, clothing accessories, shoes, jewellery, luggage and leather goods were down 0.5 percent.
On the upside, gasoline and fuel was up 0.9 percent. Core sales excluding motor vehicles and gasoline and fuel, were up 0.4 percent on the month, led by a 3.0 percent gain in sporting goods, hobby, musical instrument, book, and miscellaneous sales.
While the Bank of Canada, in minutes released during the week covering the March 6 meeting, said monetary policy was working "largely as expected", it cited risks of policy inaction and indicated it would cut rates should its economic projections materialize.
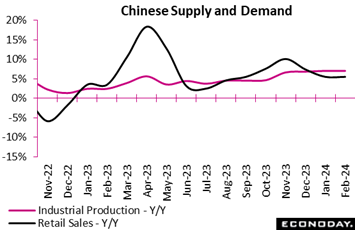 Chinese retail sales rose 5.5 percent on the year for January and February combined, down from growth of 7.4 percent in December but above the consensus forecast of 5.0 percent. Industrial production rose 7.0 percent on the year for January and February, up from growth of 6.8 percent in December and above the consensus forecast which was also 5.0 percent. Separate data for January and February are not published because of the impact of differences in the timing of lunar new year holidays from year to year. Chinese retail sales rose 5.5 percent on the year for January and February combined, down from growth of 7.4 percent in December but above the consensus forecast of 5.0 percent. Industrial production rose 7.0 percent on the year for January and February, up from growth of 6.8 percent in December and above the consensus forecast which was also 5.0 percent. Separate data for January and February are not published because of the impact of differences in the timing of lunar new year holidays from year to year.
Within the industrial sector, manufacturing output rose 7.7 percent on the year in January and February. Utilities output and mining output rose 7.9 percent and 2.3 percent respectively in the first two months of the year. In separate data, fixed asset investment rose 4.2 percent year-to-date for January and February combined, accelerating from an increase of 3.0 percent in December and above the consensus forecast of 3.2 percent.
Officials characterized the January/February updates as evidence "the national economy maintained the momentum of recovery and growth and got off to a stable start" for 2024. Following the data, the People's Bank of China left its one-year loan prime rate unchanged at 3.45 percent at its monthly review, in line with the consensus forecast. This rate has been left unchanged since August 2023. The equivalent five-year rate also left on hold at 3.95 percent after it was lowered last month by 25 basis points.
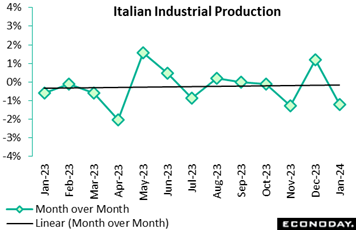 Industrial production in Italy was surprisingly weak at the start of the year. A 1.2 percent monthly drop was the third decrease since September, double the market consensus and fully unwound a marginally larger revised rise in December. Annual workday adjusted growth slumped from minus 1.5 percent to minus 3.4 percent. Industrial production in Italy was surprisingly weak at the start of the year. A 1.2 percent monthly drop was the third decrease since September, double the market consensus and fully unwound a marginally larger revised rise in December. Annual workday adjusted growth slumped from minus 1.5 percent to minus 3.4 percent.
Weakness was relatively broad-based with only intermediates (0.0 percent) and energy (2.5 percent) among the main component groups not registering a monthly decline. Consumer non-durables fell 1.5 percent, capital goods 3.6 percent and consumer durables fully 4.2 percent.
The latest setback puts the 3-monthly change in overall industrial production at minus 0.9 percent and leaves January output also 0.9 percent below its fourth quarter average. The goods producing sector fell into recession in the third quarter of 2023 and on current trends looks likely to suffer a fourth successive contraction in the current quarter.
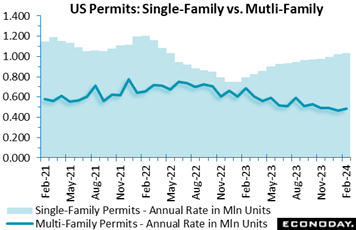 Starts of new homes in the US jumped 10.7 percent in February to 1.521 million units at a seasonally adjusted annual rate from 1.374 million units in January. The level was well above the consensus for 1.449 million units. The February increase may be in part due to milder weather than seen in January, but it also reflects rising confidence among homebuilders that the recent dip in US mortgage rates below 7 percent will help revive demand for new housing, especially while stocks of existing homes are lean. Compared to February 2023, starts were up 5.9 percent indicating that while the condition of the overall housing market is on the soft side due to borrowing costs and home prices, new construction is nevertheless active. Starts of new homes in the US jumped 10.7 percent in February to 1.521 million units at a seasonally adjusted annual rate from 1.374 million units in January. The level was well above the consensus for 1.449 million units. The February increase may be in part due to milder weather than seen in January, but it also reflects rising confidence among homebuilders that the recent dip in US mortgage rates below 7 percent will help revive demand for new housing, especially while stocks of existing homes are lean. Compared to February 2023, starts were up 5.9 percent indicating that while the condition of the overall housing market is on the soft side due to borrowing costs and home prices, new construction is nevertheless active.
Starts of single-family homes jumped 11.6 percent to 1.129 million units in February after 1.012 million units in January and were up 35.2 percent compared to a year ago. The volatile multi-unit sector saw starts up 8.3 percent in February to 392,000 units but down 34.8 percent from 601,000 units a year ago. Demand for multi-units has eased from activity in 2022 and early 2023 when there was a wave of renters seeking to buy at a time when monthly rental costs were escalating. For the past year, the market has shifted to building single-family homes to fill the gap in available inventories of homes to buy.
The number of permits issued rose 1.9 percent to 1.518 million units in February which was close to the consensus of 1.500 million. Permits suggest an ongoing moderate pace of housing starts in the future, but no significant backlog in projects. On the year and as tracked in the accompanying graph, permits were up 2.4 percent. Single-family permits were up 1.0 percent on the month to a 1.031 million rate for a 29.5 percent year-over-year jump. Multi-unit permits were up 4.1 percent on the month but down 29.0 percent on the year.
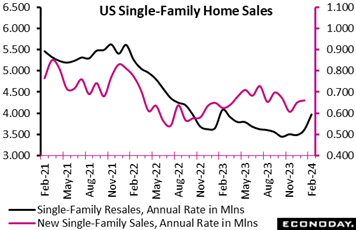 Sales of US existing homes rose 9.5 percent in February to 4.38 million units at a seasonally adjusted annual rate after 4.00 million units in January. Sales of single-family homes, as tracked in the black line of the graph, rose 10.3 percent in February to 3.970 million units, but were down 2.7 percent from a year ago (the red line of new single-family sales will be updated in the coming week). Sales of condos and co-ops rose 2.5 percent in February to 410,000, but were down 8.9 percent compared to a year earlier. The report cited "life-changing" events that are probably driving the current sales pace as consumers can "no longer delay" the decision to put a home up for sale or to buy one. Sales of US existing homes rose 9.5 percent in February to 4.38 million units at a seasonally adjusted annual rate after 4.00 million units in January. Sales of single-family homes, as tracked in the black line of the graph, rose 10.3 percent in February to 3.970 million units, but were down 2.7 percent from a year ago (the red line of new single-family sales will be updated in the coming week). Sales of condos and co-ops rose 2.5 percent in February to 410,000, but were down 8.9 percent compared to a year earlier. The report cited "life-changing" events that are probably driving the current sales pace as consumers can "no longer delay" the decision to put a home up for sale or to buy one.
"Additional housing supply is helping to satisfy market demand." The report continued, "Housing demand has been on a steady rise due to population and job growth, though the actual timing of purchases will be determined by prevailing mortgage rates and wider inventory choices."
The report noted that consumers may be accepting the "new normal" of higher mortgage rates and that 3 percent mortgage rates are a thing of the past. The average Freddie Mac rate for a 30-year fixed rate mortgage is 6.74 percent for March to-date.
The supply of homes available for sale dipped to 2.9 months' worth in February after 3.0 months in January, but above the severe lows of 2.6 months in February 2023. However, the number of homes available for sale rose 5.9 percent to 1.070 million. The median home price increased 1.6 percent to $384,500 in February from $378,600 in January and up 5.7 percent from $363,600 a year ago.
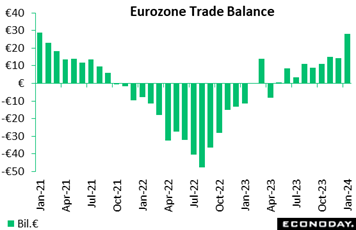 The Eurozone’s seasonally adjusted merchandise trade balance began the year in a healthy surplus. At €28.1 billion, January's black ink was nearly double December's upwardly revised €14.3 billion and well above anything seen in 2023. However, while the improvement in part reflected a 2.1 percent monthly rise in exports, the bulk of the work was done by imports which declined 4.0 percent. Unadjusted, the balance was in an €11.4 billion surplus, a marked improvement on a €32.6 billion deficit in January last year. The Eurozone’s seasonally adjusted merchandise trade balance began the year in a healthy surplus. At €28.1 billion, January's black ink was nearly double December's upwardly revised €14.3 billion and well above anything seen in 2023. However, while the improvement in part reflected a 2.1 percent monthly rise in exports, the bulk of the work was done by imports which declined 4.0 percent. Unadjusted, the balance was in an €11.4 billion surplus, a marked improvement on a €32.6 billion deficit in January last year.
January’s update leaves a broadly flat trend for exports and a declining path for imports. The former now shows positive unadjusted yearly growth (1.3 percent) for the first time since last June but the import rate (minus 16.1 percent) remains deep in negative territory. Both sides of the balance sheet continue to be impacted by the war in Ukraine. Hence, for the EU as a whole, exports to Russia were down 27.2 percent on the year while and imports were off fully 61.3 percent.
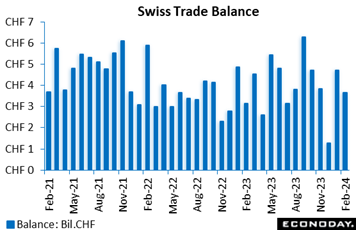 Switzerland’s merchandise trade surplus narrowed from January's CHF4.70 billion to CHF3.66 billion in February. However, this was still well above the CHF3.32 billion posted in February 2023. That said, the yearly improvement masked a 0.2 percent drop in exports and reflected instead a 2.0 percent fall in imports. The import rate has been sub-zero every month since last February. Switzerland’s merchandise trade surplus narrowed from January's CHF4.70 billion to CHF3.66 billion in February. However, this was still well above the CHF3.32 billion posted in February 2023. That said, the yearly improvement masked a 0.2 percent drop in exports and reflected instead a 2.0 percent fall in imports. The import rate has been sub-zero every month since last February.
Seasonally adjusted, exports just rose 0.1 percent on the month while imports were up 2.9 percent, mainly on the back of a 4.8 percent bounce in chemicals and pharmaceuticals. The real inflation-adjusted trade balance also deteriorated as export volumes edged up 0.2 percent and imports expanded 3.8 percent. However, so far this quarter the surplus is more than 16 percent larger than its average level in the fourth quarter of last year. Accordingly, net merchandise goods trade remains on course to provide a small boost to first quarter GDP growth.
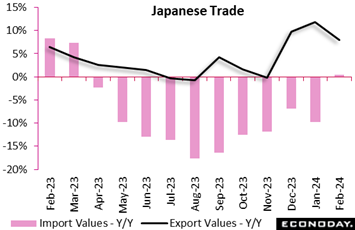 Japanese export values rose 7.8 percent on year in February for the third straight increase, led by continued strong demand for automobiles and auto parts from the U.S. and Europe. The pace of increase was faster than the consensus call of a 5.7 percent gain but it slowed from the 11.9 percent rise in January due to the lunar new year holidays in some parts of Asia after rush pre-holiday shipments in January. Japanese export values rose 7.8 percent on year in February for the third straight increase, led by continued strong demand for automobiles and auto parts from the U.S. and Europe. The pace of increase was faster than the consensus call of a 5.7 percent gain but it slowed from the 11.9 percent rise in January due to the lunar new year holidays in some parts of Asia after rush pre-holiday shipments in January.
Import values posted their first year-over-year increase in 11 months, up just 0.5 percent (consensus was a 4.0 percent rise), after falling a revised 9.8 percent in January. The increase was led by purchases of clothing, computers and refined petroleum products. Imports of coal and liquefied natural gas continued to fall on soft energy prices. Those of semiconductors from China also declined.
The trade balance recorded a ¥379.4 billion deficit after a ¥1,760.3 billion deficit in January and a ¥58.88 billion surplus in December. The deficit was narrower than the median forecast of ¥826.2 billion, a ¥928.9 billion deficit in February 2023 and a record shortfall of ¥3,506.43 billion (¥3.51 trillion) hit in January 2023.
Shipments to China, one of the key export markets for Japanese goods, posted their third straight increase after a year-long decline through November amid a gradual recovery in the world's second-largest economy. Japanese exports to the European Union also posted the third consecutive gain after showing their first year-over-year drop in 33 months in November while exports to the US remained robust, up for the 29th straight month, after rising to a record high in December 2023.
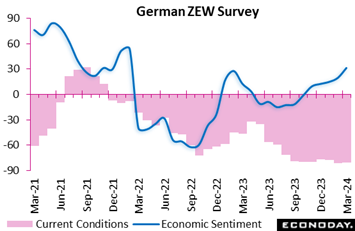 Germany’s ZEW March survey found analysts becoming a little less pessimistic about the current state of the German economy and notably more upbeat about the outlook. The results were on the strong side of the market consensus. Germany’s ZEW March survey found analysts becoming a little less pessimistic about the current state of the German economy and notably more upbeat about the outlook. The results were on the strong side of the market consensus.
The current conditions index rose 1.2 points to minus 80.5. However, this was only its first increase since December and still made for its second weakest mark since August 2020. Indeed, the latest print was nearly 65 points short of its pre-Covid mark. However, economic sentiment (expectations) again improved sharply. An 11.8 point jump to 31.7 was the eighth increase in as many months and the steepest of the sequence. The latest level was the highest since February 2022.
Analysts are becoming increasingly confident about recovery prospects for the German economy, reinforced no doubt by expectations for further falls in inflation and, as a result, a cut in ECB interest rates next quarter. That said, March's results also suggest that GDP is seen contracting again this quarter.
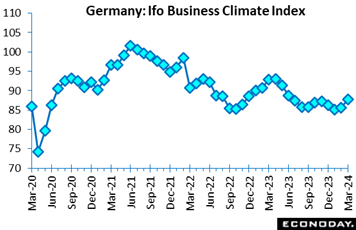 Like the ZEW, Ifo's March survey also points to an improvement in German conditions. At 87.8, the overall climate indicator for March was up 2.1 points versus February, its largest increase since March last year and its highest mark since June 2023. It was also nearly 2 points above the Econoday’s consensus. Like the ZEW, Ifo's March survey also points to an improvement in German conditions. At 87.8, the overall climate indicator for March was up 2.1 points versus February, its largest increase since March last year and its highest mark since June 2023. It was also nearly 2 points above the Econoday’s consensus.
Current conditions advanced 1.2 points to 88.1, their first gain since November albeit only a 3-month peak. Expectations again fared much better, climbing fully 3.1 points to 87.5, their steepest rise since November 2022 and their best level since May last year.
All of the main sectors posted an improvement in sentiment with manufacturing up some 7.1 points at minus 10.0, trade up 7.9 points at minus 22.9, services up 4.3 points at 0.3 and construction up 1.9 points at minus 33.5.
In sum, the March results are clearly stronger than anticipated and probably rather more optimistic than the flash PMI which we’ll look at next. Nonetheless, both reports are still historically soft and leave the German economy on course to slide into recession this quarter.
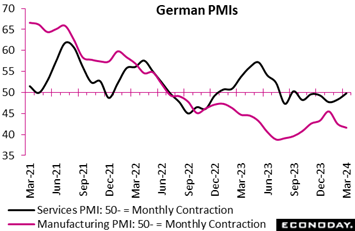 Germany’s flash PMI data proved slightly stronger than expected but still suggest economic activity remained very sluggish this month, especially manufacturing where the index fell from 42.5 to 41.6, a five-month low and deep in recession territory. By contrast, its service sector counterpart rose from 48.3 to 49.8, essentially signaling stagnation. Germany’s flash PMI data proved slightly stronger than expected but still suggest economic activity remained very sluggish this month, especially manufacturing where the index fell from 42.5 to 41.6, a five-month low and deep in recession territory. By contrast, its service sector counterpart rose from 48.3 to 49.8, essentially signaling stagnation.
New orders for the combined sectors fell again but by the least since last June due to a reduced drag from overseas demand. Backlogs similarly decreased further as did overall employment despite a modest increase in services. Nonetheless, business expectations about the year ahead improved for a sixth straight month to reach their highest level since April last year. That said, they remained short of their long-run average.
Meantime, input cost inflation decelerated for the first time in five months, driven by a smaller increase in services despite ongoing rises in wages. Output price inflation also declined to register its weakest print in four months. The rate here now stands close to its long-run average.
March’s paints a fairly gloomy picture of the German economy in general and of the manufacturing sector in particular. As indicated by a host of data, first quarter GDP looks all the more likely to be negative.
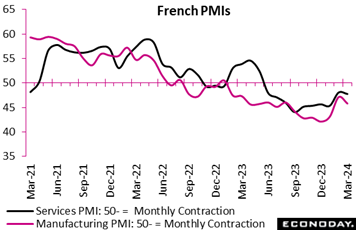 Business activity in France continued to contract in March and at a faster rate than expected and by more than in February. At 47.7, the headline flash composite output index was down from February's final 48.1 albeit only a 2-month low. Business activity in France continued to contract in March and at a faster rate than expected and by more than in February. At 47.7, the headline flash composite output index was down from February's final 48.1 albeit only a 2-month low.
The overall deterioration reflected weaker performances by both manufacturing and services. The flash sector PMI for the former fell from February's final 47.1 to 45.8 and for the latter from 48.4 to 47.8.
Aggregate demand continued to shrink with further declines in both domestic and overseas demand. Manufacturing output (47.2) also decreased again although by the least in 14 months. Employment was down for the fourth time in the last five months but job losses were confined to manufacturing as services registered a small increase. Reduced backlogs helped to support output. Despite the generally gloomy backdrop, business expectations about the year ahead remained positive and even climbed to their highest level since January 2023.
Input costs increased again for both sectors and inflation rates remained above their long-term trend. Prices charged also increased but by the least in more than three years. In part, this reflected further discounting by manufacturers.
Overall, the March results are disappointingly soft and, irrespective of improving sentiment, suggest first quarter GDP will be weak.
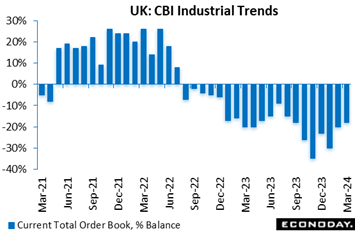 The CBI's industrial trends survey found another contraction in demand at quarter-end. However, at minus 18 percent, March's headline orders gauge was at least a couple of percentage points above its February print and in line with the market consensus. While remaining below its long-run average (minus 13 percent), it also matched its best reading since last August. Expected output (8 percent after 4 percent) and expected selling prices (21 percent after 17 percent) both rose, the latter to their highest level since last May. For comparison, the UK’s manufacturing PMI improved to 49.9 in March’s flash, indicating virtually no change in monthly conditions and, however flat, is the best showing since July 2022. The CBI's industrial trends survey found another contraction in demand at quarter-end. However, at minus 18 percent, March's headline orders gauge was at least a couple of percentage points above its February print and in line with the market consensus. While remaining below its long-run average (minus 13 percent), it also matched its best reading since last August. Expected output (8 percent after 4 percent) and expected selling prices (21 percent after 17 percent) both rose, the latter to their highest level since last May. For comparison, the UK’s manufacturing PMI improved to 49.9 in March’s flash, indicating virtually no change in monthly conditions and, however flat, is the best showing since July 2022.
Economic data proved much better than expected in the week, lifting the global economy’s Relative Performance Index (RPI) to 23 for the best score since the outset of 2024. Inflation data aren’t skewing the results which hold at 26 less prices (RPI-P).
Significant upside surprises in China’s data boosted this country’s RPI to 50 and the RPI-P to 60 and paved the way for the PBoC to leave the benchmark 1-year loan prime rate unchanged at 3.45 percent. However, continued outperformance will be needed if policy rates are not to be lowered again over coming months.
Following downside surprises in late February and early March, the latest US data have resumed a clear upside bias lifting both the RPI and RPI-P to 31. First quarter growth is shaping up well, justifying the Federal Reserve’s decision to leave policy on hold and further raising questions over forecasts for aggressive easing in 2024.
Also resuming an upside bias, and for the first time this year, are Canada’s data, at 12 overall and at 31 when excluding what have been cooler-than-expected inflation data. If this marks the beginning of a new trend, talk of a Bank of Canada rate cut would be inevitable.
Signs that the Eurozone economy in March may marginally outperform expectations were only enough to put the region’s RPI at minus 4 and the RPI-P at 5. Overall economic activity is behaving much as expected but that still implies sluggish growth and falling inflation. A June cut in ECB interest rates looks more likely than not.
In the UK, the apparent rebound in growth this quarter continues but, with the RPI slipping to minus 17 and the RPI-P to minus 11, forecasters have started to get a little ahead of themselves. Even so, the improvement in the wider economic picture has eased pressure on the Bank of England for an early cut in Bank Rate.
Last week’s reduction in the Swiss National Bank’s policy rate might not have been the market consensus but the string of the country’s negative RPI and RPI-P readings seen since the middle of last year had made for plenty of risk. The latest values (7 and 5 respectively) show forecasters having now adjusted from their excessive optimism. Even so, the inflation undershoot has been large enough to make another cut in June a real possibility.
In Japan, the first hike in BoJ interest rates in 17 years was already fully discounted. Indeed, the 10 basis point increase was about as small as operationally practical and will have been limited by the clear downside bias in surprises in the economic data since the start of the year. Even now, the RPI (minus 9) and, in particular, the RPI-P (minus 29) still show overall economic activity falling short of expectations.
**Contributing to this article were Jeremy Hawkins, Brian Jackson, Mace News, Max Sato, and Theresa Sheehan
Preliminary March reports on French and Italian consumer prices will be posted on Friday and will set up expectations for the Eurozone’s harmonised report on Wednesday, April 3; expectations are flat to lower for France and higher but still very low for Italy. Tokyo consumer prices for March will also be posted on Friday and will set up forecasts for the month’s national consumer prices to be posted in mid-April; slowing rates of inflation are expected.
PCE price indexes, part of Friday’s personal income and outlays report, will wind up US inflation data for the month of February and are not expected to show much if any improvement. Australia will post its CPI report for the month of February on Wednesday.
Canadian GDP for the month of January will be a highlight of Thursday’s session and is expected at plus 0.4 percent. Both Japanese retail sales and industrial production will be posted on Friday with a soft report expected for the latter. And posted on Sunday, March 31 Chinese time will be the country’s official CFLP PMI report which is expected to show improvement for manufacturing.
Singapore CPI for February (Mon 1300 SGT; Mon 0500 GMT; Mon 0100 EDT)
Consensus Forecast, Year over Year: 3.0%
Consumer prices in February, which in January slowed sharply and surprisingly to 2.9 percent from 3.9 percent, are expected to give back only a tick to 3.0 percent.
Germany: GfK Consumer Climate for April (Tue 0800 CET; Tue 0700 GMT; Tue 0300 EDT)
Consensus Forecast: -27.9
Currently trending sideways, consumer climate is expected to rise to minus 27.9 in April’s report after a preliminary minus 29.0 in March.
US Durable Goods Orders for February (Tue 0830 EDT; Tue 1230 GMT)
Consensus Forecast: Month over Month: 1.3%
Consensus Forecast: Ex-Transportation - M/M: 0.5%
Consensus Forecast: Core Capital Goods Orders - M/M: 0.1%
Forecasters see durable goods orders rising 1.3 percent in February following a 6.2 percent drop in January that reflected a swing lower for aircraft. Ex-transportation orders are seen up a solid 0.5 percent in February with core capital goods, which were unchanged in January, expected to inch 0.1 percent higher.
US Consumer Confidence Index for March (Tue 1000 EDT; Tue 1400 GMT)
Consensus Forecast: 106.7
The consumer confidence index is expected to come in unchanged in March at February’s 106.7 level. February was far short of expectations for 115.0 and was down from 110.9 January.
Australian February CPI (Wed 1130 AEDT; Wed 0030 GMT; Tue 2030 EDT)
Consensus Forecast, Year over Year: 3.5%
Consumer prices in February are expected to edge higher to 3.5 percent year-over-year versus a lower-than-expected 3.4 percent in January and 3.4 percent in December as well.
Eurozone: EC Economic Sentiment for March (Wed 1100 CET; Wed 1000 GMT; Wed 0600 EDT)
Consensus Forecast: 95.8
Consensus Forecast, Industry Sentiment: -9.0
Consensus Forecast, Consumer Sentiment: -14.9
Economic sentiment in March is expected to rise slightly to 95.8 from February’s 95.4 which remained well short of the 100 long-run average.
Australian Retail Sales for February (Thu 1130 AEDT; Thu 0030 GMT; Wed 2030 EDT)
Consensus Forecast, Month over Month: 0.4%
Retail sales in February are expected to increase 0.4 percent on the month after January’s 1.1 percent gain that was lower than expected and followed December’s 2.7 percent slump.
German Retail Sales for February (Thu 0800 CET; Thu 0700 GMT; Thu 0300 EDT)
Consensus Forecast, Month over Month: 0.5%
Consensus Forecast, Year over Year: -0.8%
Sales volumes are expected to rise 0.5 percent in February versus January’s weaker-than-expected 0.4 percent decline that indicated retailers were continuing to struggle.
Eurozone M3 Money Supply for February (Thu 1000 CET; Thu 0900 GMT; Thu 0500 EDT)
Consensus Forecast, Year-over-Year: 0.3%
The trend rate of decline in M3 has become gradually more shallow with the consensus for February at a 0.3 percent rise for the annual 3-month moving average. This would follow a 0.2 percent decline in January.
Canadian Monthly GDP for January (Thu 0830 EDT; Thu 1230 GMT)
Consensus Forecast, Month over Month: 0.4%
After no change in December, GDP in January is expected to rise a noticeable 0.4 percent.
Korean Industrial Production for February (Fri 0800 KST; Thu 2300 GMT; Thu 1900 EDT)
Consensus Forecast, Month over Month: 0.3%
Industrial production is expected to increase 0.3 percent on the month in February versus a 1.3 percent fall in January that followed a 0.5 percent fall in December.
Tokyo Consumer Price Index for March (Fri 0830 JST; Thu 2330 GMT; Thu 1930 EDT)
Consensus Forecast, Year over Year: 2.5%
Ex-Fresh Food, Consensus Forecast: 2.4%
Ex-Fresh Food & Energy, Consensus Forecast: 2.9%
Overall inflation in Tokyo is expected to slow a tick to 2.5 percent in March following February’s 2.6 percent. Underlying rates are expected at 2.4 percent for the ex-fresh food core versus February’s 2.5 percent and at 2.9 percent for the ex-fresh food ex-energy core-core versus 3.1 percent.
Japanese Industrial Production for February (Fri 0850 JST; Thu 2350 GMT; Thu 1950 EDT)
Consensus Forecast, Month over Month: 1.0%
Consensus Forecast, Year over Year: -2.8%
Industrial production on the month in February is expected to rebound only 1.0 percent following a steep 7.5 percent slump in January that reflected the suspension of vehicle output over a safety scandal. Year-over-year, February’s contraction is expected at 2.8 percent versus 1.5 percent contraction in January. The government downgraded its assessment in the January report, saying the industrial sector had "weakened while taking one step forward and one step back."
Japanese Retail Sales for February (Fri 0850 JST; Thu 2350 GMT; Thu 1950 EDT)
Consensus Forecast, Month over Month: 1.1%
Consensus Forecast, Year over Year: 2.8%
Retail sales are expected to rise to 2.8 percent year-over-year growth in February versus 2.3 percent growth in January. The government maintained its assessment in the January report that retail sales were “taking one step forward and one step back”.
French CPI, Preliminary March (Fri 0845 CET; Fri 0745 GMT; Thu 0345 EDT)
Consensus Forecast, Year over Year: 3.0%
Consumer inflation in March is expected to hold steady at 3.0 percent. When harmonised, forecasters are looking for slowing to 0.7 percent monthly and 2.8 percent annually that would compare with February’s 0.9 and 3.2 percent.
German Unemployment Rate for March (Fri 0955 CET; Fri 0855 GMT; Fri 0455 EDT)
Consensus Forecast: 5.9%
March’s unemployment rate is expected to hold steady at February’s 5.9 percent.
Italian CPI, Preliminary for March (Fri 1100 CET; Fri 1000 GMT; Fri 0600 EDT)
Consensus Forecast, Month over Month: 0.3%
Consensus Forecast, Year over Year: 1.4%
Consumer price inflation is expected to rise but remain low, at a consensus 1.4 percent in March versus 0.8 percent n February. The monthly rate is seen up 0.3 percent versus February’s 0.1 percent increase.
US International Trade in Goods (Advance) for February (Fri 0830 EDT; Fri 1230 GMT)
Consensus Forecast, Balance: -$90.6 billion
The US goods deficit (Census basis) is expected to hold steady at $90.6 billion in February after deepening by $2.8 billion in January to $90.5 billion.
US Personal Income for February (Fri 0830 EDT; Fri 1230 GMT)
Consensus Forecast, Month over Month: 0.4%
US Consumption Expenditures
Consensus Forecast, Month over Month: 0.5%
US PCE Price Index
Consensus Forecast, Month over Month: 0.4%
Consensus Forecast, Year over Year: 2.5%
US Core PCE Price Index
Consensus Forecast, Month over Month: 0.3%
Consensus Forecast, Year over Year: 2.8%
Personal income is expected to rise 0.4 percent in February with consumption expenditures expected to increase 0.5 percent. These would compare with January’s unexpected 1.0 percent jump in income and as-expected 0.2 percent increase in consumption. Inflation readings for February are expected at monthly increases of 0.4 percent overall and 0.3 percent for the core (versus 0.3 and 0.4 percent increases in January which were both as expected). Annual rates are expected at 2.5 percent overall and 2.8 percent for the core (versus January’s 2.4 and 2.8 percent which were also both as expected).
China: CFLP PMIs for March (Sun 0930 CST; Sun 0130 GMT; Sat 2130 EDT)
Manufacturing PMI, Consensus Forecast: 50.2
The CFLP manufacturing PMI is expected to increase more than a point to 50.2 in March from February’s 49.1 which was the fifth straight sub-50 reading.
|
