|
Policy makers are telling us it's real, that the November 1 & 2 FOMC will be "live" — that an immediate rate hike will be seriously discussed. But talk is easy, raising rates is hard. Especially when the meeting immediately precedes the November 8th presidential election not even to mention that it will follow a wave of not-so-great economic data that are not, that's right not, pointing to much risk of overheating anytime soon.
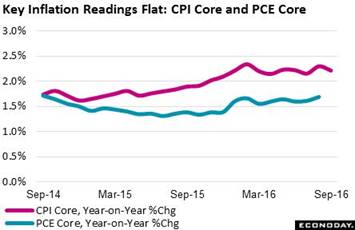 Overall inflation may be on the rise as energy comparisons become easier and easier but when looking at the core, which excludes both energy and also food, the trend is more flat than up. CPI core prices edged only 0.1 percent higher in September with the year-on-year rate, which is what the Fed tracks, moving in the wrong direction, down 1 tenth to 2.2 percent. Due to a different methodology, the CPI core (red line in graph) runs about 1/2 percentage point above the Fed's specific target which is the PCE core, but it's the direction that counts and the dip does not point to accelerating pressure for the PCE measure (blue line). Weak areas in the September report include apparel, down 0.7 percent on the month, and communications, down 0.8 percent. Vehicle prices have been soft with new prices down 0.1 percent both on the month and on the year and with used vehicles especially weak, down 0.3 percent on the month and down 4.1 percent on the year. Overall inflation may be on the rise as energy comparisons become easier and easier but when looking at the core, which excludes both energy and also food, the trend is more flat than up. CPI core prices edged only 0.1 percent higher in September with the year-on-year rate, which is what the Fed tracks, moving in the wrong direction, down 1 tenth to 2.2 percent. Due to a different methodology, the CPI core (red line in graph) runs about 1/2 percentage point above the Fed's specific target which is the PCE core, but it's the direction that counts and the dip does not point to accelerating pressure for the PCE measure (blue line). Weak areas in the September report include apparel, down 0.7 percent on the month, and communications, down 0.8 percent. Vehicle prices have been soft with new prices down 0.1 percent both on the month and on the year and with used vehicles especially weak, down 0.3 percent on the month and down 4.1 percent on the year.
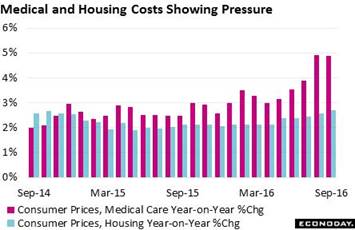 But there are areas where prices are going higher led by medical care, up 4.9 percent from a year ago, and also housing which is up 2.7 percent. Inflation is evident across the medical component led by hospital services at 6.0 percent, medical commodities at 5.2 percent and physician services at 4.1 percent. Medical care is a major cost for consumers, making up 9 percent of the CPI, but housing is by far the dominant component at 43 percent. Here inflation is less severe but still very evident with owners' equivalent rent (an indirect measure of mortgage costs) up 3.4 percent while rent of primary shelter is up even more, at 3.7 percent. But there are areas where prices are going higher led by medical care, up 4.9 percent from a year ago, and also housing which is up 2.7 percent. Inflation is evident across the medical component led by hospital services at 6.0 percent, medical commodities at 5.2 percent and physician services at 4.1 percent. Medical care is a major cost for consumers, making up 9 percent of the CPI, but housing is by far the dominant component at 43 percent. Here inflation is less severe but still very evident with owners' equivalent rent (an indirect measure of mortgage costs) up 3.4 percent while rent of primary shelter is up even more, at 3.7 percent.
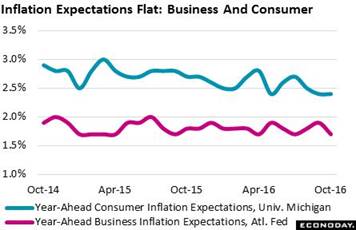 Energy costs are definitely on the rise though from a low base. Year-on-year, energy is still down 2.9 percent which however is well up from 20 percent lows following the 2014 oil collapse. Even with no more than incremental gains ahead, energy prices will begin adding to the overall inflation rate. A major offset, however, may be food which, after two years of steady declines, posted its first year-on-year contraction of the cycle, at minus 0.3 percent in September. Food makes up 14 percent of the CPI or double the 7 percent that energy makes. And higher energy prices or not, inflation expectations remain subdued, edging lower this month in the University of Michigan's consumer measure to 2.4 percent and bouncing lower for the Atlanta Fed's business reading to 1.7 percent. In the background of all this is wage inflation which, despite reports of rising employer costs, remains subdued, at only 2.6 percent for average hourly wages as detailed in the prior week's September employment report. Energy costs are definitely on the rise though from a low base. Year-on-year, energy is still down 2.9 percent which however is well up from 20 percent lows following the 2014 oil collapse. Even with no more than incremental gains ahead, energy prices will begin adding to the overall inflation rate. A major offset, however, may be food which, after two years of steady declines, posted its first year-on-year contraction of the cycle, at minus 0.3 percent in September. Food makes up 14 percent of the CPI or double the 7 percent that energy makes. And higher energy prices or not, inflation expectations remain subdued, edging lower this month in the University of Michigan's consumer measure to 2.4 percent and bouncing lower for the Atlanta Fed's business reading to 1.7 percent. In the background of all this is wage inflation which, despite reports of rising employer costs, remains subdued, at only 2.6 percent for average hourly wages as detailed in the prior week's September employment report.
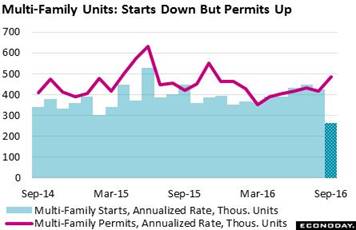 The quirkiest news of the week comes from starts & permits for multi-family units which posted one of their widest gaps ever. Permits rose a monthly 17 percent to a 486,000 annualized rate for their best showing in nearly a year. Rent costs, as seen in the CPI, are on the rise which is no doubt a key factor behind the permit gain. But starts, in a shocking contrast, plunged 38 percent in the month to a 264,000 rate. Multi-unit starts and permits had been moving in lockstep for most of the year and September's disconnect points to one-time factors, such as construction delays, that can be expected to lift quickly. News on the single-family side is more stable, with starts up a very sharp 8.1 percent to a 783,000 rate and with permits up a useful 0.4 percent to 739,000. Year-on-year, single-family starts are up 5.4 percent with permits up 4.4 percent. The quirkiest news of the week comes from starts & permits for multi-family units which posted one of their widest gaps ever. Permits rose a monthly 17 percent to a 486,000 annualized rate for their best showing in nearly a year. Rent costs, as seen in the CPI, are on the rise which is no doubt a key factor behind the permit gain. But starts, in a shocking contrast, plunged 38 percent in the month to a 264,000 rate. Multi-unit starts and permits had been moving in lockstep for most of the year and September's disconnect points to one-time factors, such as construction delays, that can be expected to lift quickly. News on the single-family side is more stable, with starts up a very sharp 8.1 percent to a 783,000 rate and with permits up a useful 0.4 percent to 739,000. Year-on-year, single-family starts are up 5.4 percent with permits up 4.4 percent.
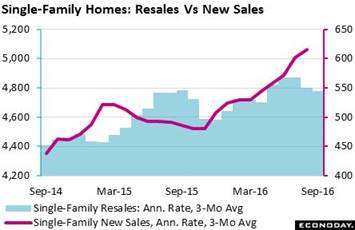 September's sharp gain for single-family starts is certain to help new home sales which in turn should spillover and help the resale market. Single-family resales rose an outsized 4.1 percent in September to a 4.860 million annualized rate but housing data are volatile and when smoothing this out with a 3-month average, the rate dips to 4.780 million for a second straight decline. Price appreciation for resales, stuck in the 5 percent range, has been less than robust and may not be encouraging homeowners to put their existing homes up for sale, a factor that has been holding down the number of resales on the market. But gains underway for new home sales where the 3-month average has been soaring, to a cycle high of 616,000 in the last set of data, could increase interest in moving from an old home to a new one. New home sales for September will be a highlight of the coming week's data, scheduled for release on Wednesday, October 26. September's sharp gain for single-family starts is certain to help new home sales which in turn should spillover and help the resale market. Single-family resales rose an outsized 4.1 percent in September to a 4.860 million annualized rate but housing data are volatile and when smoothing this out with a 3-month average, the rate dips to 4.780 million for a second straight decline. Price appreciation for resales, stuck in the 5 percent range, has been less than robust and may not be encouraging homeowners to put their existing homes up for sale, a factor that has been holding down the number of resales on the market. But gains underway for new home sales where the 3-month average has been soaring, to a cycle high of 616,000 in the last set of data, could increase interest in moving from an old home to a new one. New home sales for September will be a highlight of the coming week's data, scheduled for release on Wednesday, October 26.
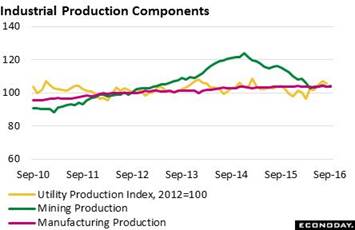 Flat is really not the best word to describe housing, where net growth is slow but apparent, but it's a perfectly good word, unfortunately, for the factory sector. The latest evidence is the industrial production report which inched up only 0.1 percent in September following a 0.5 percent decline in August. The manufacturing component did rise a nearly respectable 0.2 percent but follows a 0.5 percent August decline. Vehicle production has been flat while production of business equipment, in the latest indication of trouble for business investment, has posted back-to-back declines. A plus is the mining component which has been showing stability as energy prices firm. The graph tracks the index levels of the report's three components with the mining production curve the same as the curve for oil prices, rising sharply as prices rose in the first part of the recovery then falling sharply beginning in 2014 as prices collapsed. Yet mining is recovering and there's potential for future strength as its year-on-year rate, at minus 9.4 percent, still has plenty of room for improvement. The year-on-year rate for total industrial production, pulled down by mining, is at minus 1.0 percent. And the year-on-year rate for manufacturing' You guessed it, dead zero. Flat is really not the best word to describe housing, where net growth is slow but apparent, but it's a perfectly good word, unfortunately, for the factory sector. The latest evidence is the industrial production report which inched up only 0.1 percent in September following a 0.5 percent decline in August. The manufacturing component did rise a nearly respectable 0.2 percent but follows a 0.5 percent August decline. Vehicle production has been flat while production of business equipment, in the latest indication of trouble for business investment, has posted back-to-back declines. A plus is the mining component which has been showing stability as energy prices firm. The graph tracks the index levels of the report's three components with the mining production curve the same as the curve for oil prices, rising sharply as prices rose in the first part of the recovery then falling sharply beginning in 2014 as prices collapsed. Yet mining is recovering and there's potential for future strength as its year-on-year rate, at minus 9.4 percent, still has plenty of room for improvement. The year-on-year rate for total industrial production, pulled down by mining, is at minus 1.0 percent. And the year-on-year rate for manufacturing' You guessed it, dead zero.
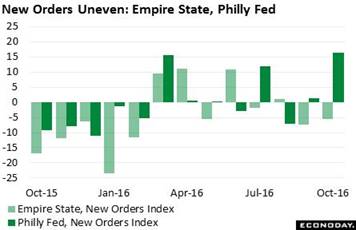 And what are the early factory indications for the month of October' The Empire State report, produced by the New York Fed to track its manufacturing sector, is subdued this month with the headline coming in at minus 6.80 vs similar readings in September and August. The details are mostly negative with new orders at minus 5.60 for a second straight sub-zero score. Shipments are at minus 0.60 with employment in reverse for a fourth straight month, at minus 4.70. In contrast is the Philly Fed report where strength has suddenly burst forth. The headline index is a solid plus 9.7 with growth in new orders, at 16.3 this month, the strongest since November 2014 and shipments, at 15.3, the second strongest since November 2014. The graph tracks new orders of the two reports. There's been more monthly gains than losses since March this year but the trend is far from uniformly positive as it becomes when manufacturing is on the climb. But the surprise strength for the Philly Fed sets up what should be an interesting run of anecdotal factory reports this month including the Richmond Fed on Tuesday and the Kansas City Fed on Thursday of the coming week. And what are the early factory indications for the month of October' The Empire State report, produced by the New York Fed to track its manufacturing sector, is subdued this month with the headline coming in at minus 6.80 vs similar readings in September and August. The details are mostly negative with new orders at minus 5.60 for a second straight sub-zero score. Shipments are at minus 0.60 with employment in reverse for a fourth straight month, at minus 4.70. In contrast is the Philly Fed report where strength has suddenly burst forth. The headline index is a solid plus 9.7 with growth in new orders, at 16.3 this month, the strongest since November 2014 and shipments, at 15.3, the second strongest since November 2014. The graph tracks new orders of the two reports. There's been more monthly gains than losses since March this year but the trend is far from uniformly positive as it becomes when manufacturing is on the climb. But the surprise strength for the Philly Fed sets up what should be an interesting run of anecdotal factory reports this month including the Richmond Fed on Tuesday and the Kansas City Fed on Thursday of the coming week.
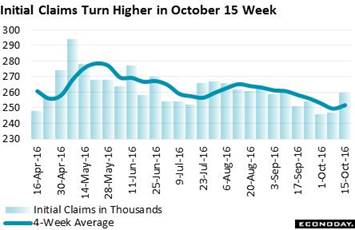 The factory sector is definitely not a reason for the Fed to raise rates but lack of slack in the labor market is, right' Well, it has been but may be less so this month. The first reliable leading indication on any month's employment report comes from weekly jobless claims, specifically initial claims during the mid-month sampling week of the employment report. And initial jobless claims moved higher in the October 15 week, up a sizable 13,000 to a 260,000 level that is up 9,000 from the September sampling week. But the indication is a little clouded by trends going into the sampling week as the latest 4-week average, at 251,750, is actually down 6,500 from the September comparison. The tie breaker will be continuing claims but the results will have to wait until the coming week's report as this series is reported with a 1-week lag. Hurricane Matthew is a possible wildcard for the October employment report but it doesn't look to be a very powerful one at all. Initial claims data during the latest week, which was in the aftermath of the storm, show no significant change for the three states hit the hardest: Florida, Georgia and South Carolina. The factory sector is definitely not a reason for the Fed to raise rates but lack of slack in the labor market is, right' Well, it has been but may be less so this month. The first reliable leading indication on any month's employment report comes from weekly jobless claims, specifically initial claims during the mid-month sampling week of the employment report. And initial jobless claims moved higher in the October 15 week, up a sizable 13,000 to a 260,000 level that is up 9,000 from the September sampling week. But the indication is a little clouded by trends going into the sampling week as the latest 4-week average, at 251,750, is actually down 6,500 from the September comparison. The tie breaker will be continuing claims but the results will have to wait until the coming week's report as this series is reported with a 1-week lag. Hurricane Matthew is a possible wildcard for the October employment report but it doesn't look to be a very powerful one at all. Initial claims data during the latest week, which was in the aftermath of the storm, show no significant change for the three states hit the hardest: Florida, Georgia and South Carolina.
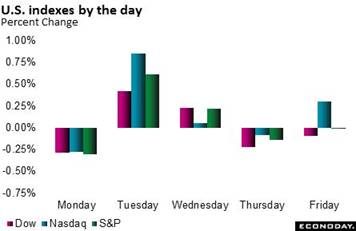 Treasury rates held steady in the week, ending two weeks of upward drift triggered by speculation that the European Central Bank might begin to taper their bond purchases. But ECB head Mario Draghi dumped cold water on the idea, saying at his post-meeting press conference that tapering was not discussed at Thursday's policy meeting. But the rise in rates has led to a distinct rise in the dollar where year-to-date depreciation has now all but evaporated, to minus 0.1 percent on the dollar index. Strength in the dollar may increase foreign demand for U.S. assets but it erodes foreign demand for U.S. goods and services which become more expensive in foreign currencies. And strength in the dollar, which allows Americans to buy foreign products at a discount, is not a positive for the Fed's efforts to stimulate inflation. For the presidential election' Markets continue to show little reaction going into the vote with the Dow, ending at 18,145, posting a fractional gain in points on the week but no percentage change. Treasury rates held steady in the week, ending two weeks of upward drift triggered by speculation that the European Central Bank might begin to taper their bond purchases. But ECB head Mario Draghi dumped cold water on the idea, saying at his post-meeting press conference that tapering was not discussed at Thursday's policy meeting. But the rise in rates has led to a distinct rise in the dollar where year-to-date depreciation has now all but evaporated, to minus 0.1 percent on the dollar index. Strength in the dollar may increase foreign demand for U.S. assets but it erodes foreign demand for U.S. goods and services which become more expensive in foreign currencies. And strength in the dollar, which allows Americans to buy foreign products at a discount, is not a positive for the Fed's efforts to stimulate inflation. For the presidential election' Markets continue to show little reaction going into the vote with the Dow, ending at 18,145, posting a fractional gain in points on the week but no percentage change.
| Markets at a Glance |
Year-End |
Week Ended |
Week Ended |
Year-To-Date |
Weekly |
|
2015 |
14-Oct-16 |
21-Oct-16 |
Change |
Change |
| DJIA |
17,425.03 |
18,138.38 |
18,145.71 |
4.1% |
0.0% |
| S&P 500 |
2,043.94 |
2,132.98 |
2,141.16 |
4.8% |
0.4% |
| Nasdaq Composite |
5,007.41 |
5,214.16 |
5,257.40 |
5.0% |
0.8% |
|
|
|
|
|
|
| Crude Oil, WTI ($/barrel) |
$37.40 |
$50.37 |
$50.89 |
36.1% |
1.0% |
| Gold (COMEX) ($/ounce) |
$1,060.00 |
$1,252.60 |
$1,267.40 |
19.6% |
1.2% |
|
|
|
|
|
|
| Fed Funds Target |
0.25 to 0.50% |
0.25 to 0.50% |
0.25 to 0.50% |
0 bp |
0 bp |
| 2-Year Treasury Yield |
1.05% |
0.85% |
0.84% |
–21 bp |
–1 bp |
| 10-Year Treasury Yield |
2.27% |
1.80% |
1.74% |
–53 bp |
–6 bp |
| Dollar Index |
98.84 |
98.06 |
98.7 |
-0.1% |
0.7% |
Overshooting inflation is the central question facing Fed policy makers right now but, at a time when economic momentum is in short supply, it's more of a theoretical risk than a tangible one. A very tangible risk right now is politics going into the November FOMC, cross fire that will encourage policy makers to keep their heads down. But the December FOMC is another story, one that will turn, however, on economic data yet to unfold.
The first reading on third-quarter GDP will be the week's highlight on Friday. Leading into the report on Thursday will be durable goods orders, which have been weak, and new home sales on Wednesday which have been strong. Home prices have been soft but mostly respectable and both FHFA and Case-Shiller will be released on Tuesday. Resale levels will also be posted in the week with an advance indication in the pending home sales report on Thursday. Friday's GDP report is expected to rise at a solid rate, at an Econoday consensus of 2.5 percent with consumer spending expected to prove respectable and offset weakness in business investment. Friday will also include the third-quarter employment cost index where continued pressure is expected and would be consistent with tight conditions in the labor market.
Manufacturing PMI, October Flash
Consensus Forecast: 51.2
Consensus Range: 50.9 to 51.7
The manufacturing PMI is expected to remain soft for the October flash, at a consensus 51.2 vs a final 51.5 in September and 51.4 for the September flash. Growth in new orders was the weakest of the year in September while export sales, due to what the report said was the strong dollar, contracted for the first time in four months. Unlike most other reports, this report has been citing the presidential election as a factor, specifically a negative one that it says has been delaying customer decisions.
FHFA House Price Index for August
Consensus Forecast: +0.5%
Consensus Range: +0.4% to +0.7%
Appreciation in home prices has been moderate this year, trending in the 5 percent range for most readings which however is more than respectable when inflation is low and wage growth limited. The FHFA house price index has been at the top of list, rising a monthly 0.5 percent in the last report for July and pushing the 6 percent line at plus 5.8 percent for the year-on-year rate. Forecasters see the monthly rate for August holding steady and solid at plus 0.5 percent.
Case-Shiller, 20-City Adjusted Index for August
Consensus Forecast, Month-to-Month Change: +0.2%
Consensus Range: 0.0% to +0.4%
Case-Shiller, 20-City Unadjusted Index
Consensus Forecast, Year-on-Year Change: +5.1%
Consensus Range: +5.0% to +5.3%
The Case-Shiller 20-city index has been lagging other indications on home prices, having posted no monthly gain since March. The year-on-year rate for July, the last period posted, is the low for the year, at plus 5.0 percent. But forecasters see the index improving slightly in August, to a monthly plus 0.2 percent for a yearly 5.1 percent.
Consumer Confidence Index for October
Consensus Forecast: 101.0
Consensus Range: 98.6 to 106.5
Readings on consumer confidence as a whole have been mixed. Showing by far the most strength is the Conference Board's consumer confidence index which is up nearly 7-1/2 points over the last two months, coming in at 104.1 in September for a new cycle high. The jobs-hard-to-get reading has been coming down consistently and sizably and has been pointing at improvement in the labor market. Forecasters thought the consumer confidence index would give up some of August's gains in the September report, which it didn't, and they see October's report, at a consensus 101.0, giving back a big part of September's gain.
International Trade In Goods for October
Consensus Forecast, Month-to-Month Change: -$60.5 billion
Consensus Range: -$64.8 to -$58.0 billion
The nation's trade deficit in goods totaled $60.3 billion in August (revised from $58.4 billion) and forecasters see little change in September with the consensus at $60.5. Goods exports rose a solid 1.0 percent in the prior report led by industrial supplies, vehicles, and also consumer goods. Imports also rose but in perhaps a sign of weakness in business confidence, imports of consumer goods declined for a second month.
New Home Sales for September
Consensus Forecast, Annualized Rate: 601,000
Consensus Range: 570,000 to 635,000
New home sales came on strong during the summer, averaging an annualized rate of 616,000 that is 25 percent higher than last summer. But strong sales have been depleting supply which is very low and have been holding down what could be even stronger sales. Forecasters see September's rate coming in at 601,000 in what would be a limited 1.3 percent decrease from 609,000 in September. The new home sales report excludes multi-family homes and tracks only the key single-family home category where permits, in a sign of optimism for future sales, have been on the climb.
Durable Goods Orders for September
Consensus Forecast, Month-to-Month Change: +0.2%
Consensus Range: -0.7% to +0.8%
Durable Goods Orders, Ex-Transportation
Consensus Forecast: +0.1%
Consensus Range: -0.2% to +0.3%
Durable goods orders and the factory sector with it have been flat this year. Forecasters see orders rising only 0.2 percent in September with ex-transportation orders, which strip out monthly swings in aircraft orders, rising even less, only 0.1 percent. Good news has been hard to find though orders for core capital goods did pick up in the last report.
Initial Jobless Claims for October 22 week
Consensus Forecast: 255,000
Consensus Range: 250,000 to 262,000
Initial jobless claims have been tracking at historic lows and pointing to healthy conditions in the labor market though they did rise 13,000 in the October 15 week to 260,000 for the highest level in five weeks. Forecasters see initial claims moving back down, 5,000 lower to 255,000 in the October 22 week.
Pending Home Sales Index for September
Consensus Forecast, Month-to-Month Change: +1.0%
Consensus Range: +0.5% to +2.5%
Resales have been flat all year, only fractionally above the year-ago level at the same time that new home sales have been growing at a 25 percent rate. But forecasters see pending sales bouncing back from August, up a consensus plus 1.0 percent in September.
Real GDP, 3rd Quarter, 1st Estimate, Annualized Rate
Consensus Forecast: +2.5%
Consensus Range: +2.2% to +3.1%
GDP Price Index
Consensus Forecast: +1.5%
Consensus Range: +1.2% to +1.8%
The Econoday consensus for the first estimate of third-quarter GDP is plus 2.5 percent, a solid rate that what would be the highest in five quarters. Consumer spending is expected to be solid but still down from the second-quarter's very strong 4.4 percent annualized growth rate. Nonresidential investment was a plus in the second quarter but is expected to be a negative in the third quarter. The GDP price index accelerated sharply in the second quarter reflecting energy prices, to plus 2.3 percent from the second quarter's plus 1.4 percent but is expected to move sharply lower in the third quarter, to a consensus plus 1.5 percent.
Employment Cost Index for 3rd Quarter
Consensus Forecast, Quarter-to-Quarter Change: +0.6%
Consensus Range: +0.6% to +0.8%
The employment cost index rose a constructive 0.6 percent in the second quarter and forecasters see another 0.6 percent gain in the third quarter which would be the fourth gain at this rate in the last five quarters. Wages & salaries have been leading the report, rising 2.5 percent on a year-over-year basis in the last report against a 2.0 percent rise in benefits. The risk that tight conditions in the labor market are raising employer costs is the bedrock argument for policy hawks at the Federal Reserve.
Consumer Sentiment Index, Final October
Consensus Forecast: 88.5
Consensus Range: 88.0 to 92.5
Consumer sentiment moved sharply lower in the first part of October, to 87.9 from September's final reading at 91.2. Weakness was isolated to expectations and reflected less confidence in future income prospects. In contrast, the assessment of current conditions rose slightly to hint at October gains in consumer spending. Forecasters see the final October reading coming in at 88.5.
|
