|
The majority may be getting thinner but the doves still rule at the Fed, at least for now, voting to keep rates unchanged. The doves see little risk that inflation will be taking off anytime soon and they're worried that a rate hike might trip up the labor market just when discouraged workers are coming back in. Janet Yellen said as much in her post-FOMC press conference. But the economy is still moving forward and the split 7 to 3 vote is in-your-face proof that the hawks have launched a big offensive. By tradition, of course, FOMC policy makers are careful not to make headlines going into a presidential election, yet strong employment reports for both September and October could put the Federal Reserve where it doesn't want to be — on the front pages during the final days of the election.
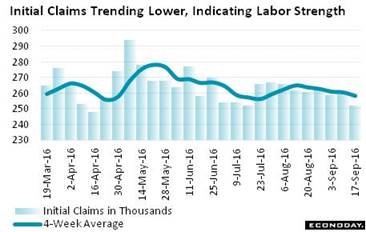 If the Fed does vote to hike rates in November it will be, with almost complete certainty, solely because of the employment reports. And the outlook for the September report (watch out) is clearly positive. Initial jobless claims for the sample week of the monthly employment report, in this case the week ended September 17, fell 8,000 to a level of 252,000 which is 10,000 below the August sample week (week ended August 13 at 262,000). The 4-week average, always important to look at in weekly data which are bumpy, confirms the strength of the labor market, down 6,750 from the August sample week to 258,500. This is evidence, hard evidence, that conditions are good if not better than in August when nonfarm payrolls rose a respectable enough 151,000. And the latest claims level of 252,000 is in fact exactly where it was in the July sample week when payrolls for that month rose 275,000 and is actually 6,000 lower than in the June sample week when payrolls rose 271,000. What does it all mean? Well, if you're at the Fed it means payrolls could easily come in over 200,000 in September which would have the doves really scrambling for reasons not to raise rates. If the Fed does vote to hike rates in November it will be, with almost complete certainty, solely because of the employment reports. And the outlook for the September report (watch out) is clearly positive. Initial jobless claims for the sample week of the monthly employment report, in this case the week ended September 17, fell 8,000 to a level of 252,000 which is 10,000 below the August sample week (week ended August 13 at 262,000). The 4-week average, always important to look at in weekly data which are bumpy, confirms the strength of the labor market, down 6,750 from the August sample week to 258,500. This is evidence, hard evidence, that conditions are good if not better than in August when nonfarm payrolls rose a respectable enough 151,000. And the latest claims level of 252,000 is in fact exactly where it was in the July sample week when payrolls for that month rose 275,000 and is actually 6,000 lower than in the June sample week when payrolls rose 271,000. What does it all mean? Well, if you're at the Fed it means payrolls could easily come in over 200,000 in September which would have the doves really scrambling for reasons not to raise rates.
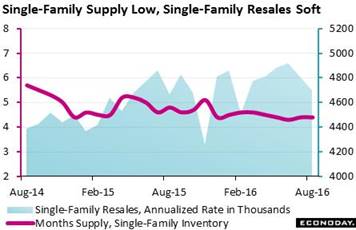 If the FOMC does vote for a rate hike in November, the stubbornly flat resale market in the housing sector won't be to blame. Existing home sales, despite very low mortgage rates, fell a monthly 0.9 percent in August to a 5.33 million annualized rate. Key to the report is the single-family component which fell 2.3 percent in the month, a disappointment masked by condos which jumped a monthly 10.5 percent to a 630,000 rate. Despite the monthly mismatch, the trends for both categories are dead flat, the result of stubbornly thin supply. The graph compares the monthly supply of single-family homes, at 4.4 months in the last two reports, with resales of single-family homes, which came in at 4.70 million in August. When including condos, supply on a monthly basis is at 4.6 months with 3.3 percent fewer resales available, at 2.04 million from July's 2.11 million. Prices aren't offering great incentives for possible sellers, with the median down 1.3 percent in the month to $240,200 for a year-on-year rate of plus 5.1 percent. A 5 percent handle isn't much for home-price appreciation, in fact it's near the very lows of the cycle, but then again it's respectable enough in an economy where wage growth is low. If the FOMC does vote for a rate hike in November, the stubbornly flat resale market in the housing sector won't be to blame. Existing home sales, despite very low mortgage rates, fell a monthly 0.9 percent in August to a 5.33 million annualized rate. Key to the report is the single-family component which fell 2.3 percent in the month, a disappointment masked by condos which jumped a monthly 10.5 percent to a 630,000 rate. Despite the monthly mismatch, the trends for both categories are dead flat, the result of stubbornly thin supply. The graph compares the monthly supply of single-family homes, at 4.4 months in the last two reports, with resales of single-family homes, which came in at 4.70 million in August. When including condos, supply on a monthly basis is at 4.6 months with 3.3 percent fewer resales available, at 2.04 million from July's 2.11 million. Prices aren't offering great incentives for possible sellers, with the median down 1.3 percent in the month to $240,200 for a year-on-year rate of plus 5.1 percent. A 5 percent handle isn't much for home-price appreciation, in fact it's near the very lows of the cycle, but then again it's respectable enough in an economy where wage growth is low.
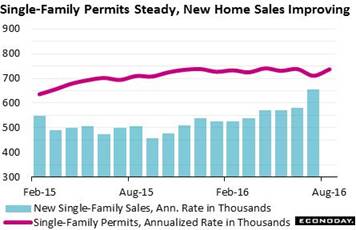 The strength of this year's housing sector is on the new home side. Housing starts and permits did fall in August, down a sharp 5.4 percent for starts to a 1.142 million annualized rate and down 0.4 percent for permits to 1.139 million. But permit growth for single-family homes, which is a central indication for housing demand, bounced back 3.7 percent from a weak July to a 737,000 rate which, as seen in the red line of the graph, is about as good as it gets. But the nearer term outlook is less positive as actual starts for single-family homes, likely reflecting supply constraints in the construction sector, fell 6.0 percent to a 722,000 rate. Though lack of incoming supply is certain to limit ongoing sales, sales of new homes have nevertheless been on the climb, sloping convincingly higher since this time last year and then spiking in the last report for July as tracked in the blue bars of the graph. And prospects for ongoing strength in the new home sales report are very solid based at least on the home builders' housing market index which is up a very sharp 6 points this month to 71, a level last matched in October last year. The August new homes sales report will be a highlight of the coming week's calendar and confirmation of strength in this often volatile series, especially confirmation of the strength of the July report, would not be much help to the doves at the next FOMC meeting. The strength of this year's housing sector is on the new home side. Housing starts and permits did fall in August, down a sharp 5.4 percent for starts to a 1.142 million annualized rate and down 0.4 percent for permits to 1.139 million. But permit growth for single-family homes, which is a central indication for housing demand, bounced back 3.7 percent from a weak July to a 737,000 rate which, as seen in the red line of the graph, is about as good as it gets. But the nearer term outlook is less positive as actual starts for single-family homes, likely reflecting supply constraints in the construction sector, fell 6.0 percent to a 722,000 rate. Though lack of incoming supply is certain to limit ongoing sales, sales of new homes have nevertheless been on the climb, sloping convincingly higher since this time last year and then spiking in the last report for July as tracked in the blue bars of the graph. And prospects for ongoing strength in the new home sales report are very solid based at least on the home builders' housing market index which is up a very sharp 6 points this month to 71, a level last matched in October last year. The August new homes sales report will be a highlight of the coming week's calendar and confirmation of strength in this often volatile series, especially confirmation of the strength of the July report, would not be much help to the doves at the next FOMC meeting.
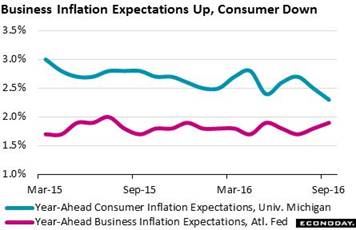 What has really been supporting the doves is weakness in inflation expectations, especially weakness at the consumer level which Yellen cited directly at her press conference for a reason against an immediate rate hike. But that's the consumer level. The latest week's data include a modest uptick, but still an uptick, in business expectations for year-ahead inflation which are up 1 tenth this month to 1.9 percent. The rate matches May as the best of the year and the highest since 2.0 percent in July last year. The gain comes despite no change in the sample's unit costs which are at a very subdued plus 1.5 percent for a third straight month. And given the lack of cost push, the uptick in inflation expectations hints at an improving outlook for business demand and with it, offers the hawks another reason perhaps to raise rates. What has really been supporting the doves is weakness in inflation expectations, especially weakness at the consumer level which Yellen cited directly at her press conference for a reason against an immediate rate hike. But that's the consumer level. The latest week's data include a modest uptick, but still an uptick, in business expectations for year-ahead inflation which are up 1 tenth this month to 1.9 percent. The rate matches May as the best of the year and the highest since 2.0 percent in July last year. The gain comes despite no change in the sample's unit costs which are at a very subdued plus 1.5 percent for a third straight month. And given the lack of cost push, the uptick in inflation expectations hints at an improving outlook for business demand and with it, offers the hawks another reason perhaps to raise rates.
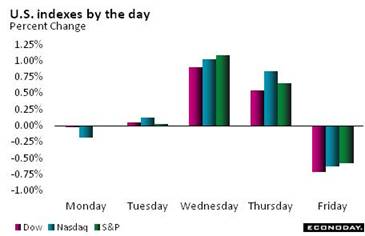 Chances may not be good for a rate hike at the November meeting but there are chances after all. And how would the markets react to a November rate hike? One possibility is that risk taking would pick up on the logic that the Fed is confident in the strength of the economy and that long term inflationary risks are being contained. But another possibility is that risk taking could go south on concern that the hike, coming at a time of slow growth, would mark the last high point of this cycle's economy. Risk taking in the week appeared to get a lift from the FOMC announcement as the Dow, despite a selloff on Friday, posted a 0.8 percent gain on the week. The dollar index ended the week 0.6 percent lower at 95.46 with oil up 3.9 percent to $44.70. Gold had a good week, up 2.5 percent to 1,341. Chances may not be good for a rate hike at the November meeting but there are chances after all. And how would the markets react to a November rate hike? One possibility is that risk taking would pick up on the logic that the Fed is confident in the strength of the economy and that long term inflationary risks are being contained. But another possibility is that risk taking could go south on concern that the hike, coming at a time of slow growth, would mark the last high point of this cycle's economy. Risk taking in the week appeared to get a lift from the FOMC announcement as the Dow, despite a selloff on Friday, posted a 0.8 percent gain on the week. The dollar index ended the week 0.6 percent lower at 95.46 with oil up 3.9 percent to $44.70. Gold had a good week, up 2.5 percent to 1,341.
| Markets at a Glance |
Year-End |
Week Ended |
Week Ended |
Year-To-Date |
Weekly |
|
2015 |
16-Sep-16 |
23-Sep-16 |
Change |
Change |
| DJIA |
17,425.03 |
18,123.80 |
18,261.45 |
4.8% |
0.8% |
| S&P 500 |
2,043.94 |
2,139.16 |
2,164.69 |
5.9% |
1.2% |
| Nasdaq Composite |
5,007.41 |
5,244.57 |
5,305.75 |
6.0% |
1.2% |
|
|
|
|
|
|
| Crude Oil, WTI ($/barrel) |
$37.40 |
$43.03 |
$44.70 |
19.5% |
3.9% |
| Gold (COMEX) ($/ounce) |
$1,060.00 |
$1,308.35 |
$1,341.50 |
26.6% |
2.5% |
|
|
|
|
|
|
| Fed Funds Target |
0.25 to 0.50% |
0.25 to 0.50% |
0.25 to 0.50% |
0 bp |
0 bp |
| 2-Year Treasury Yield |
1.05% |
0.76% |
0.76% |
–29 bp |
0 bp |
| 10-Year Treasury Yield |
2.27% |
1.69% |
1.62% |
–65 bp |
–7 bp |
| Dollar Index |
98.84 |
96.02 |
95.46 |
-3.4% |
-0.6% |
One thing a rate hike at this month's FOMC would have done is remove the risk that they would have to move at the November FOMC, the date for which by the way is November 2nd. The date for the election is November 8th. But, no kidding, the possibility of a November hike may actually be real. Eric Rosengren, president of the Boston Fed, is the big surprise in the latest vote, a widely viewed dove turned hawk. If he goes over, then maybe St. Louis' Bullard could vote for a hike or even one or two of the governors. At 7 to 3, Yellen doesn't have a lot room to maneuver and perhaps more incentive to give in. For a chair to get outvoted is a rare thing, last happening to G. William Miller in the Jimmy Carter days. Yet, who knows, maybe the hawks themselves will want to give in, not wanting to cause a big election fuss.
Three indicators with market-moving punch will be spread evenly through the week. Out Monday are new homes sales which have been running strong followed on Wednesday by durable goods orders which have been bumpy and down. Personal income and spending will headline Friday's data with a recent run of strength for wages & salaries at stake.
New Home Sales for August
Consensus Forecast, Annualized Rate: 598,000
Consensus Range: 575,000 to 630,000
The new home market is one of the bright spots of the 2016 economy, with new home sales accelerating impressively through the spring and early summer. But forecasters see a pause for August, calling for a consensus 5.1 percent monthly decline to a 598,000 annualized rate following July's 12.4 percent surge to 654,000. The new home sales report excludes multi-family homes and tracks only the key single-family home category where permits, in a sign of optimism for future sales, have been on the climb.
Case-Shiller, 20-City Adjusted Index for July
Consensus Forecast, Month-to-Month Change: +0.1%
Consensus Range: -0.2% to +0.2%
Case-Shiller, 20-City Unadjusted Index
Consensus Forecast, Year-on-Year Change: +5.2%
Consensus Range: +4.8% to +5.3%
Price gains for existing homes have been coming down which is a plus for sales that up to now, at least on the existing home side, have also been flat. Forecasters see the Case-Shiller 20-city index, which tracks prices of existing homes, inching 0.1 percent higher in what would break 3 straight months of decline. Forecasters see the year-on-year rate coming in unchanged at plus 5.1 percent which is respectable in a low inflation economy. This rate had been trending at 6.0 percent early in the year.
Consumer Confidence Index for September
Consensus Forecast: 98.8
Consensus Range: 96.4 to 102.3
Readings on consumer confidence have held steady at solid levels this year including the Conference Board's consumer confidence index which jumped nearly 4-1/2 points to 101.1 in August. Forecasters see the index giving back some of August's gain with the September consensus at 98.8. Among positives in the report has been a widening in those who see their incomes improving which boils down to confidence in the jobs market. Buying plans for homes have also been on the climb.
Durable Goods Orders for August
Consensus Forecast, Month-to-Month Change: -1.9%
Consensus Range: -2.8% to 0.0%
Durable Goods Orders, Ex-Transportation
Consensus Forecast: -0.5%
Consensus Range: -1.5% to +0.4%
Durable goods orders jumped 4.4 percent in July with ex-transportation up an outsized 1.5 percent, gains however that are not expected to be repeated in August. On the contrary, forecasters are calling for a 1.9 percent decline with ex-transportation down 0.5 percent in results that would underscore the factory sector's flat trajectory. Special attention will be focused on core capital goods where orders did pick up in the last report though shipments, which are an important input into GDP, fell back for a third straight month.
Real GDP, 2nd Quarter, 3rd Estimate, Annualized Rate
Consensus Forecast: +1.3%
Consensus Range: +1.1% to +1.5%
GDP Price Index
Consensus Forecast: +2.3%
Consensus Range: +2.3% to +2.3%
The third estimate for second-quarter GDP is expected to come in at a soft plus 1.3 percent, up 2 tenths from the second estimate of 1.1 percent reflecting expected improvement in nonresidential investment which however has been very weak. But masked in the data is impressive strength in consumer spending, at a 4.4 percent annualized growth rate in the second estimate. Inventory growth slowed sharply in the second quarter, pulling down GDP but also perhaps increasing the need to the replenish inventories in what would be a positive for both third-quarter growth and employment. The GDP price index, reflecting energy prices, accelerated sharply in the second quarter, to plus 2.3 percent and is expected to hold steady in the third estimate.
International Trade In Goods for August
Consensus Forecast, Month-to-Month Change: -$62.3 billion
Consensus Range: -$64.0 to -$59.2 billion
A surge in food exports helped cut the nation's goods gap from June's $65.6 billion to $60.3 billion in July (revised from $59.3 billion). But other export readings were less favorable including a decline for capital goods that points to weak global investment in new equipment. Imports of consumer goods were also weak in July which is a plus for GDP but points to lack of business confidence in domestic consumer demand. Forecasters see the headline for international trade in goods widening following July's dip, to a consensus deficit of $62.3 billion.
Initial Jobless Claims for September 24 week
Consensus Forecast: 260,000
Consensus Range: 256,000 to 265,000
Initial jobless claims have been tracking at historic lows and pointing to lack of layoffs and healthy conditions in the labor market. Continuing claims have likewise been very low. Forecasters see initial claims climbing only modestly, up 8,000 in the September 24 week from the prior week's unusually low reading of 252,000.
Pending Home Sales Index for August
Consensus Forecast, Month-to-Month Change: +0.5%
Consensus Range: -0.9% to +1.3%
Pending home sales had been weak this year but rose a sharp 1.3 percent in July to signal needed improvement in final sales of existing homes which have been flat. Forecasters see pending sales slowing only modestly from July jump, to a consensus plus 0.5 percent in August.
Personal Income for August
Consensus Forecast, Month-to-Month Change: +0.2%
Consensus Range: +0.1% to +0.3%
Consumer Spending
Consensus Forecast: +0.2%
Consensus Range: +0.1% to +0.3%
PCE Price Index
Consensus Forecast: +0.2%
Consensus Range: +0.1% to +0.2%
Core PCE Price Index
Consensus Forecast: +0.2%
Consensus Range: +0.2% to +0.3%
Consumer spending posted a solid 0.3 percent gain in July despite softness in core retail sales during the month. Weakness in total retail sales in August has forecasters calling for only a 0.2 percent gain. Personal income has also been solid, boosted in June and July by outsized 0.5 percent gains in wages & salaries. But forecasters see August income also slowing to plus 0.2 percent. Modest strength following a run of weakness is expected for both the PCE price index and the core PCE price index where forecasters are calling for 0.2 percent gains for each.
Chicago PMI for August
Consensus Forecast: 52.0
Consensus Range: 50.9 to 53.5
The Chicago PMI slumped to 51.5 in August after solid back-to-back scores of 55.8 and 56.8 in July and June. New orders slowed through the summer which points to ongoing weakness in overall activity. Forecasters are calling for only a 1/2 point bounce back to 52.0 for September. This report tracks both the manufacturing and non-manufacturing sectors of the Chicago economy.
Consumer Sentiment Index, Preliminary September
Consensus Forecast: 90.1
Consensus Range: 89.0 to 90.6
Consumer sentiment has been steady and respectable, ending August with a final reading of 89.8. The expectations component has been solid which points to confidence in the jobs outlook. But current conditions, the report's second component, have been edging lower to indicate easing strength in the current jobs market. Inflation readings, reflecting the summer's downdraft in gasoline prices, have been unusually low. Forecasters see the index edging higher in the September flash to 90.1.
|
