|
A picture of the summer economy is emerging, strength at the season's beginning followed by a holding pattern at the end. But be careful reading ahead. You can't tell a book by its cover and you can't always judge an indicator by its headline.
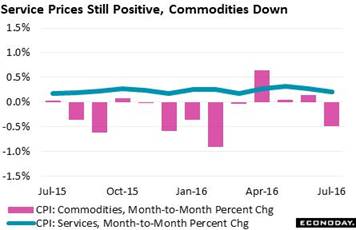 Consumer prices aren't showing very much strength at the headline level, actually no strength at all. July's consumer price index came in at zero to show no monthly change. There is still change at the year-on-year level though a little less of it, at only plus 0.8 percent in July for a 2 tenths dip from June's 1.0 percent. July's dip in gasoline prices is to blame as are flat food prices, but they're not that big of factors. Excluding both food and energy, the core reading did rise but only 0.1 percent. The weakness is widespread among commodity prices which altogether, as tracked by the red bars of the graph, were down a monthly 0.5 percent to end three months of marginal progress. In contrast, service prices, which are much steadier than commodity prices, continue to show pressure though a little less so with a 0.2 percent gain in July that followed three prior months of roughly 0.3 percent monthly growth. Consumer prices aren't showing very much strength at the headline level, actually no strength at all. July's consumer price index came in at zero to show no monthly change. There is still change at the year-on-year level though a little less of it, at only plus 0.8 percent in July for a 2 tenths dip from June's 1.0 percent. July's dip in gasoline prices is to blame as are flat food prices, but they're not that big of factors. Excluding both food and energy, the core reading did rise but only 0.1 percent. The weakness is widespread among commodity prices which altogether, as tracked by the red bars of the graph, were down a monthly 0.5 percent to end three months of marginal progress. In contrast, service prices, which are much steadier than commodity prices, continue to show pressure though a little less so with a 0.2 percent gain in July that followed three prior months of roughly 0.3 percent monthly growth.
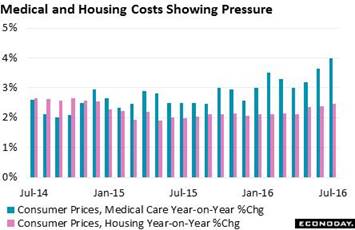 But there are key areas of inflation, core areas of their own if you will, that are indeed showing pressure. Costs for medical care are going up, hitting a year-on-year rate of 4.0 percent in July that is five times the rate for overall inflation. And the outlook for medical prices can't be that bad, boosted if nothing else than by the aging population. Housing is another key cost that's on the move, with the year-on-year rate rising 4 tenths over the past three months to hit 2.5 percent in July, or more than three times the overall rate. The hawks at the Federal Open Market Committee, which next meets in September, can turn to medical care and housing as evidence that inflation hasn't died. But there are key areas of inflation, core areas of their own if you will, that are indeed showing pressure. Costs for medical care are going up, hitting a year-on-year rate of 4.0 percent in July that is five times the rate for overall inflation. And the outlook for medical prices can't be that bad, boosted if nothing else than by the aging population. Housing is another key cost that's on the move, with the year-on-year rate rising 4 tenths over the past three months to hit 2.5 percent in July, or more than three times the overall rate. The hawks at the Federal Open Market Committee, which next meets in September, can turn to medical care and housing as evidence that inflation hasn't died.
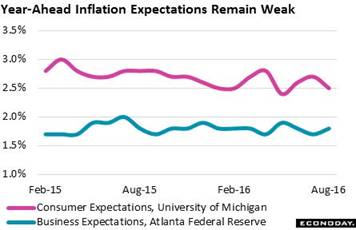 But before we get carried away, let's turn to what ordinary people think about inflation, whether in our roles at home or at work. Inflation expectations are regularly cited in the FOMC's statement and are a regular topic at Janet Yellen's press conferences. And the Fed's assessments have been upbeat, mostly firm and steady. But a look at the accompanying graph may not fill you with a lot of confidence. Year-ahead inflation expectations among businesses are up this month but not very much, 1 tenth higher to a year-on-year 1.8 percent. This reading has been as high as 1.9 percent a couple of times over the past year but has not seen the 2.0 percent level since way back in July last year. There's not much acceleration here to say the least. And acceleration isn't the worry on the consumer side where expectations may be going in reverse, down 2 tenths this month to 2.5 percent and likewise extending what looks like a long-term downward slope. Weak inflation expectations are not a positive for aggregate demand, pointing to a wait-and-see psychology among spenders who want to hold onto cash (whose value is strong) and perhaps delay their purchases (of products whose prices are already soft and perhaps in some cases will soften further). But before we get carried away, let's turn to what ordinary people think about inflation, whether in our roles at home or at work. Inflation expectations are regularly cited in the FOMC's statement and are a regular topic at Janet Yellen's press conferences. And the Fed's assessments have been upbeat, mostly firm and steady. But a look at the accompanying graph may not fill you with a lot of confidence. Year-ahead inflation expectations among businesses are up this month but not very much, 1 tenth higher to a year-on-year 1.8 percent. This reading has been as high as 1.9 percent a couple of times over the past year but has not seen the 2.0 percent level since way back in July last year. There's not much acceleration here to say the least. And acceleration isn't the worry on the consumer side where expectations may be going in reverse, down 2 tenths this month to 2.5 percent and likewise extending what looks like a long-term downward slope. Weak inflation expectations are not a positive for aggregate demand, pointing to a wait-and-see psychology among spenders who want to hold onto cash (whose value is strong) and perhaps delay their purchases (of products whose prices are already soft and perhaps in some cases will soften further).
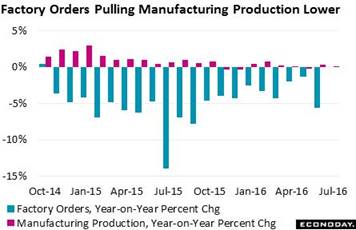 Headline strength vs underlying strength is also a theme of recent factory data. The manufacturing component of the industrial production report has suddenly burst to life, up 0.3 percent in June and an even stronger 0.5 percent in July. And here the details are positive with strength centered in vehicle production and also hi-tech goods. Looking at who buys the goods is also positive with both consumer and business goods higher. Here the uncertain contrast isn't within the report but when compared to another report all together -- factory orders. Production won't keep climbing if underlying orders are going down and that, unfortunately, is the story. Factory orders posted sharp monthly declines in the last two reports which cover May and June. And the year-on-year rates, as seen in the graph, are also not encouraging, at minus 5.6 percent in July for a 20th straight decline. The year-on-year rate for production has been skirting the zero line since November last year when it first dipped into contraction. Manufacturers can keep production up by working down unfilled orders but this can't go on forever. Unfilled orders fell a very steep 0.8 percent in the latest monthly data while the year-on-year rate has been in low single-digit contraction for the past year. The outlook for production can't be that splashy when orders are laying at the bottom of the pool. Headline strength vs underlying strength is also a theme of recent factory data. The manufacturing component of the industrial production report has suddenly burst to life, up 0.3 percent in June and an even stronger 0.5 percent in July. And here the details are positive with strength centered in vehicle production and also hi-tech goods. Looking at who buys the goods is also positive with both consumer and business goods higher. Here the uncertain contrast isn't within the report but when compared to another report all together -- factory orders. Production won't keep climbing if underlying orders are going down and that, unfortunately, is the story. Factory orders posted sharp monthly declines in the last two reports which cover May and June. And the year-on-year rates, as seen in the graph, are also not encouraging, at minus 5.6 percent in July for a 20th straight decline. The year-on-year rate for production has been skirting the zero line since November last year when it first dipped into contraction. Manufacturers can keep production up by working down unfilled orders but this can't go on forever. Unfilled orders fell a very steep 0.8 percent in the latest monthly data while the year-on-year rate has been in low single-digit contraction for the past year. The outlook for production can't be that splashy when orders are laying at the bottom of the pool.
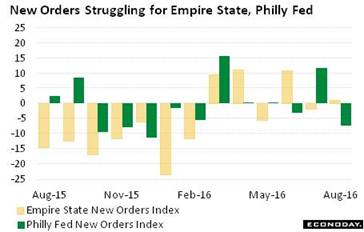 Factory orders data, however comprehensive, lag other reports by as much as a month or two including the anecdotal monthly surveys conducted by the Philadelphia Fed and also by the New York Fed for its Empire State report. The new orders indications in both these reports, admittedly based on small samples, confirm a lack of punch. New orders in Empire State barely show any monthly growth at all in August, at only 1.04, with the Philly Fed in contraction in two of the last three months, at minus 7.2 in August. These readings had been in a long contraction during 2015 following the drop in oil prices that hit the energy sector and in the wake of generally easing global demand. The bounce into the plus column during March has yet to fulfill its promise. Factory orders data, however comprehensive, lag other reports by as much as a month or two including the anecdotal monthly surveys conducted by the Philadelphia Fed and also by the New York Fed for its Empire State report. The new orders indications in both these reports, admittedly based on small samples, confirm a lack of punch. New orders in Empire State barely show any monthly growth at all in August, at only 1.04, with the Philly Fed in contraction in two of the last three months, at minus 7.2 in August. These readings had been in a long contraction during 2015 following the drop in oil prices that hit the energy sector and in the wake of generally easing global demand. The bounce into the plus column during March has yet to fulfill its promise.
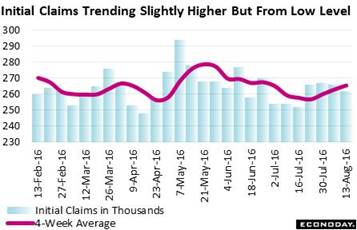 What came first? Spending or jobs? Consumers can't spend if they don't have jobs, right? So it must be jobs that came first! Maybe or maybe not but jobs are definitely what's keeping the economy going. The most telling indicator of the week -- and offering the first solid indication on the monthly employment report -- is jobless claims data and they are pointing unmistakably at labor market strength. Initial claims came in at 262,000 in the August 13 week which is not only near historic lows but is also the sample week for the monthly employment report. A comparison with the sample week of the July employment report shows only a slight increase of 10,000. Based on this indication alone, August nonfarm payroll growth may slow from July's very strong 255,000 but probably not very much. What came first? Spending or jobs? Consumers can't spend if they don't have jobs, right? So it must be jobs that came first! Maybe or maybe not but jobs are definitely what's keeping the economy going. The most telling indicator of the week -- and offering the first solid indication on the monthly employment report -- is jobless claims data and they are pointing unmistakably at labor market strength. Initial claims came in at 262,000 in the August 13 week which is not only near historic lows but is also the sample week for the monthly employment report. A comparison with the sample week of the July employment report shows only a slight increase of 10,000. Based on this indication alone, August nonfarm payroll growth may slow from July's very strong 255,000 but probably not very much.
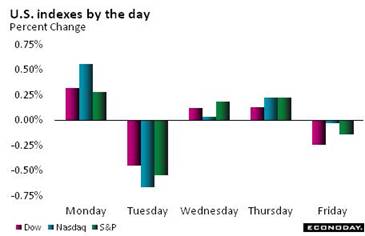 Gasoline prices have been coming down the past couple of months but aren't likely to stay down long based on oil which spiked more than 8 percent this week and is back over $48 for West Texas Intermediate. The year-on-year price is up nearly 30 percent which, however, hasn't made for much recovery at all in the oil patch where, based on data from the Kansas City and Dallas Feds, contraction is still underway. The dollar was another big mover in the week, down 1.3 percent on the dollar index with year-to-date depreciation at 4.4 percent, in what is perhaps tangible depreciation for the nation's exporters. Action in the stock market has been extremely narrow as it often is during the light volumes of August. The Dow closed the week with a 0.1 percent decline to 18,552. Gasoline prices have been coming down the past couple of months but aren't likely to stay down long based on oil which spiked more than 8 percent this week and is back over $48 for West Texas Intermediate. The year-on-year price is up nearly 30 percent which, however, hasn't made for much recovery at all in the oil patch where, based on data from the Kansas City and Dallas Feds, contraction is still underway. The dollar was another big mover in the week, down 1.3 percent on the dollar index with year-to-date depreciation at 4.4 percent, in what is perhaps tangible depreciation for the nation's exporters. Action in the stock market has been extremely narrow as it often is during the light volumes of August. The Dow closed the week with a 0.1 percent decline to 18,552.
| Markets at a Glance |
Year-End |
Week Ended |
Week Ended |
Year-To-Date |
Weekly |
|
2015 |
12-Aug-16 |
19-Aug-16 |
Change |
Change |
| DJIA |
17,425.03 |
18,576.47 |
18,552.57 |
6.5% |
-0.1% |
| S&P 500 |
2,043.94 |
2,184.05 |
2,183.87 |
6.8% |
0.0% |
| Nasdaq Composite |
5,007.41 |
5,232.89 |
5,238.38 |
4.6% |
0.1% |
|
|
|
|
|
|
| Crude Oil, WTI ($/barrel) |
$37.40 |
$44.67 |
$48.39 |
29.4% |
8.3% |
| Gold (COMEX) ($/ounce) |
$1,060.00 |
$1,340.20 |
$1,348.00 |
27.2% |
0.6% |
|
|
|
|
|
|
| Fed Funds Target |
0.25 to 0.50% |
0.25 to 0.50% |
0.25 to 0.50% |
0 bp |
0 bp |
| 2-Year Treasury Yield |
1.05% |
0.71% |
0.76% |
–29 bp |
5 bp |
| 10-Year Treasury Yield |
2.27% |
1.51% |
1.58% |
–69 bp |
7 bp |
| Dollar Index |
98.84 |
95.74 |
94.52 |
-4.4% |
-1.3% |
Lack of general inflation and weakness in the factory sector, together with the prior week's very soft showing for retail sales, suggest that the economy may be catching its breath following bursts of speed during June and July. But even if the economy does no more than hold steady in August -- specifically of course the employment report for August -- then rate hike talk will be fair play at the September FOMC.
The week's economic data will be overshadowed by the Fed's Jackson Hole symposium that begins Thursday. Janet Yellen is expected to speak but there are no details yet. New home sales will be Tuesday's focus and are expected to slow slightly from a cycle high followed on Wednesday by existing home sales which are also expected to fall back from a cycle high. The manufacturing PMI on Wednesday is expected to show some strength as are durable goods orders where the consensus for the ex-transportation reading is plus 0.5 percent. The second estimate for second-quarter GDP will round out Friday followed by consumer sentiment where readings have been flat.
New Home Sales for July
Consensus Forecast, Annualized Rate: 580,000
Consensus Range: 556,000 to 590,000
Forecasters see new home sales easing in July after a cycle high showing in June, to a 580,000 annualized rate from June's 592,000. Details of the June report were also very strong including a jump higher in prices which, however, were still lagging sales substantially which points to discounting by home builders. An increasing negative for sales is scarcity of new home sales on the market, the result in part of the strong sales rate.
FHFA House Price Index for June
Consensus Forecast: +0.3%
Consensus Range: +0.1% to +0.6%
Home prices have been very soft which is a negative for household wealth but a positive for sales which have been increasingly solid. The FHFA house price index slowed to only a 0.2 percent gain in June for one of the weakest performances of the economic cycle. Forecasters see July's index coming in only slightly better, at plus 0.3 percent.
Manufacturing PMI, August Flash
Consensus Forecast: 53.2
Consensus Range: 52.7 to 53.5
The manufacturing PMI firmed to 52.9 in the July, a moderate rate near breakeven 50 but still the best showing in 9 months and a reminder of how soft the factory sector has been this year. New orders, including those for exports, were strong in July which points to strength for production in August. Forecasters see the August flash coming in slightly higher at 53.2.
Existing Home Sales for July
Consensus Forecast, Annualized Rate: 5.520 million
Consensus Range: 5.420 to 5.650 million
Sales of existing homes are expected to fall back from June's cycle high at a 5.570 million annualized rate to a 5.520 rate. Pending home sales data, which track contract signings, have been very soft and are not pointing to any strength for this report which tracks closings. Home sales have been choppy yet still solid this year though a step back for this report would hint at slowing through the second half.
Durable Goods Orders for July
Consensus Forecast, Month-to-Month Change: +3.7%
Consensus Range: +2.0% to +5.0%
Durable Goods Orders, Ex-Transportation
Consensus Forecast: +0.5%
Consensus Range: +0.2% to +1.5%
Durable goods orders were very soft in June and May and forecasters see a big bounce back for July where the consensus is at plus 3.7 percent. But the great bulk of the jump reflects expectations for higher civilian aircraft orders. When excluding transportation, orders are expected to rise a less spectacular but still constructive 0.5 percent. Weakness in June orders, which plunged 4.0 percent, was widespread as was weakness in unfilled orders which plunged a very steep 0.9 percent. Capital goods orders did bounce back slightly in June but remain a stubborn weakness for the factory sector. It would take major gains in the July report, aside from aircraft, to improve what is a very flat outlook for manufacturing.
Initial Jobless Claims for August 20 week
Consensus Forecast: 265,000
Consensus Range: 260,000 to 271,000
Initial jobless claims are expected to hold steady in the August 20 week, at a consensus 265,000 vs 262,000 in the prior week and in line with the 4-week average of 265,250. Readings throughout this report have been consistently low and pointing to low levels of layoffs and healthy conditions in the labor market.
Real GDP, 2nd Quarter, 2nd Estimate, Annualized Rate
Consensus Forecast: +1.1%
Consensus Range: +0.8% to +1.5%
GDP Price Index
Consensus Forecast: +2.2%
Consensus Range: +2.2% to +2.2%
The second estimate for second-quarter GDP is expected to come in at plus 1.1 percent, 1 tenth lower than what proved to be a surprisingly soft first estimate of 1.2 percent. But the weakness was tied to a decline inventories, which is actually a positive for the economic outlook, and a reversal for what had been sharp rates of growth in residential investment. A strong positive for the first estimate was strength in consumer spending which rose at an annualized 4.2 percent rate. The GDP price index, reflecting energy prices, accelerated sharply, to plus 2.2 percent where it is expected to hold in the second estimate.
International Trade In Goods for June
Consensus Forecast, Month-to-Month Change: -$63.2 billion
Consensus Range: -$64.1 to -$61.0 billion
Imports of goods have been on the rise including for consumer goods which, though a subtraction in the national accounts, points squarely at business confidence in the consumer outlook. Imports of capital goods, however, have been weak in further evidence that confidence in the business outlook is lacking. Pointing unmistakably at trouble in global demand is weakness in exports including, like on the import side, for capital goods. Forecasters see the headline for international trade in goods showing little change, at a deficit of $63.2 billion in July vs $63.3 billion in June.
Consumer Sentiment Index, August Final
Consensus Forecast: 90.7
Consensus Range: 90.4 to 94.2
The mid-month reading for consumer sentiment was flat at 90.4 and little change is expected for the final reading where the Econoday consensus is at 90.7. Current conditions were the weakness in the flash report which is a negative indication for the strength of this month's jobs market and also for this month's consumer spending. But expectations were solid which points to confidence in the long-term outlook for jobs.
|
