|
The FOMC posted its own indicator of a sort this past week, let's call it the GDP expectations index. This is only an experimental indicator you understand that is still being tinkered with, nevertheless the reading for June is very telling and speaks ultimately to the Fed's own confidence in the outlook. No less telling is the week's indicator run which updates the economy's biggest strength along with some of its weaknesses.
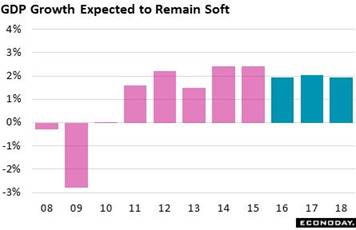 The biggest news of the week wasn't June's FOMC statement, which aside from a few minor adjustments was an exact copy of the April statement. No, the FOMC quarterly forecasts, which were released with the statement, are the eye grabbers — showing a visible downward tilt. GDP forecasts for this year and next were shifted a tenth or two lower to the 2.0 percent line and, to underscore the weakness, the high estimate for the long run tendency was also shaved and it too is now at 2.0 percent. Rate actions are also forecast to slow, down maybe one or two quarter-point hikes over the next two years. Why the shift lower? And where did all of the Fed's rate-hike fighting spirit go' What exactly has happened between now and March when the FOMC last issued its update? Global markets appear less volatile now than they did earlier in the year which is actually a plus, and the fact that global demand is still weak is no surprise. First-quarter GDP in the U.S. slowed as expected but plus 0.8 percent isn't really a disaster. Business investment is weakening but consumer spending more importantly is solid. What Janet Yellen at her press conference pointed to is payroll growth, at 38,000 in May and 123,000 in April. So this is the reason for all the not-so-great vibes. Softer job growth together with stubbornly weak productivity is not the mix for GDP strength. The biggest news of the week wasn't June's FOMC statement, which aside from a few minor adjustments was an exact copy of the April statement. No, the FOMC quarterly forecasts, which were released with the statement, are the eye grabbers — showing a visible downward tilt. GDP forecasts for this year and next were shifted a tenth or two lower to the 2.0 percent line and, to underscore the weakness, the high estimate for the long run tendency was also shaved and it too is now at 2.0 percent. Rate actions are also forecast to slow, down maybe one or two quarter-point hikes over the next two years. Why the shift lower? And where did all of the Fed's rate-hike fighting spirit go' What exactly has happened between now and March when the FOMC last issued its update? Global markets appear less volatile now than they did earlier in the year which is actually a plus, and the fact that global demand is still weak is no surprise. First-quarter GDP in the U.S. slowed as expected but plus 0.8 percent isn't really a disaster. Business investment is weakening but consumer spending more importantly is solid. What Janet Yellen at her press conference pointed to is payroll growth, at 38,000 in May and 123,000 in April. So this is the reason for all the not-so-great vibes. Softer job growth together with stubbornly weak productivity is not the mix for GDP strength.
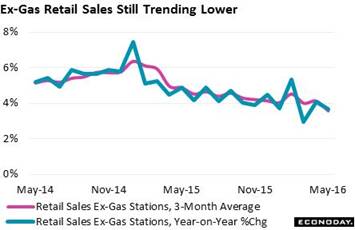 Retail sales led the week's data and proved solid enough, up a monthly 0.5 percent in May following a 1.3 percent surge in April. The strength in consumer demand has been the surprise so far of the second quarter, in what would be a key improvement from the first quarter. But some of this surprise is being overstated by gasoline sales where the ongoing spike is tied to gasoline prices, not tied to a fundamental shift higher in demand for gasoline. When excluding gasoline sales, the slope for retail sales is suddenly going in the wrong direction — that is a little South. Although ex-gas sales did rise 0.3 percent in May, the year-on-year gain slowed by 4 tenths to a very moderate 3.7 percent. Retail sales led the week's data and proved solid enough, up a monthly 0.5 percent in May following a 1.3 percent surge in April. The strength in consumer demand has been the surprise so far of the second quarter, in what would be a key improvement from the first quarter. But some of this surprise is being overstated by gasoline sales where the ongoing spike is tied to gasoline prices, not tied to a fundamental shift higher in demand for gasoline. When excluding gasoline sales, the slope for retail sales is suddenly going in the wrong direction — that is a little South. Although ex-gas sales did rise 0.3 percent in May, the year-on-year gain slowed by 4 tenths to a very moderate 3.7 percent.
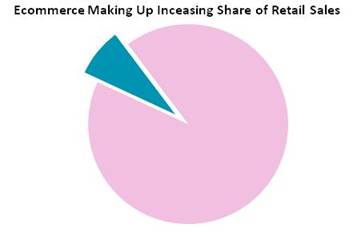 But there was definitely strength in the May retail sales report including autos and restaurants, two discretionary categories that confirm general consumer strength. And the nonstore component, reflecting big gains in ecommerce, is more and more becoming a central strength of the whole report, cranking out monthly spikes of 1.3 and 2.5 percent the last two months. Nonstore retailers lead the year-on-year score sheet, at a 12.2 percent pace. But ecommerce is only part of the nonstore category, mixed in with TV shopping, catalog sales, vending machines, etc. Ecommerce sales are, however, separated out in a quarterly report issued by the government, the last showing a 7.8 percent share of total retail sales for the first quarter. This compares with a 3.2 percentage at the beginning of the series in 2007. But there was definitely strength in the May retail sales report including autos and restaurants, two discretionary categories that confirm general consumer strength. And the nonstore component, reflecting big gains in ecommerce, is more and more becoming a central strength of the whole report, cranking out monthly spikes of 1.3 and 2.5 percent the last two months. Nonstore retailers lead the year-on-year score sheet, at a 12.2 percent pace. But ecommerce is only part of the nonstore category, mixed in with TV shopping, catalog sales, vending machines, etc. Ecommerce sales are, however, separated out in a quarterly report issued by the government, the last showing a 7.8 percent share of total retail sales for the first quarter. This compares with a 3.2 percentage at the beginning of the series in 2007.
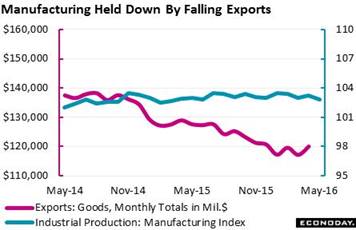 The weakness in the economy is in business investment and exports, two areas where the nation's factories, not the consumer, are on the front line. The manufacturing component of the industrial production report fell a sizable 0.4 percent in May as declines swept readings including consumer goods, business equipment and construction supplies. Vehicles, down 4.2 percent in the month, showed unusual weakness but are bound to bounce back given how strong demand is. Still, total manufacturing in this series is at a year-on-year minus 0.1 percent, just as flat as can be. Other manufacturing data in the week were mixed with Empire State showing modest promise for the New York region but the Philly Fed showing another month of declining orders in the Mid-Atlantic. The weakness in the economy is in business investment and exports, two areas where the nation's factories, not the consumer, are on the front line. The manufacturing component of the industrial production report fell a sizable 0.4 percent in May as declines swept readings including consumer goods, business equipment and construction supplies. Vehicles, down 4.2 percent in the month, showed unusual weakness but are bound to bounce back given how strong demand is. Still, total manufacturing in this series is at a year-on-year minus 0.1 percent, just as flat as can be. Other manufacturing data in the week were mixed with Empire State showing modest promise for the New York region but the Philly Fed showing another month of declining orders in the Mid-Atlantic.
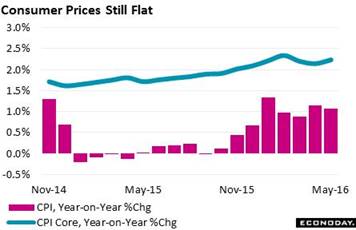 Inflation has been nearly as flat as manufacturing. The consumer price index could only inch 0.2 percent ahead in May despite gains for energy prices. When excluding energy as well as food, core inflation also rose 0.2 percent in the month. Year-on-year, total prices inched 1 tenth lower to 1.0 percent while the core inched 1 tenth higher to 2.2 percent. Nothing inspiring and nothing to make policy makers wonder whether they're behind the inflation curve. Yet there were two reports in the week that may be hinting at future pressure as producer prices posted a less-than-moderate 0.4 percent increase that includes gains for goods, which are being inflated by the ongoing climb in energy, and also gains for services where price traction hints perhaps at an uptick in industrial demand. The import & export price report showed even stronger gains but not any, however, for finished goods where prices, and by extension the outlook for consumer prices, are flat. Inflation has been nearly as flat as manufacturing. The consumer price index could only inch 0.2 percent ahead in May despite gains for energy prices. When excluding energy as well as food, core inflation also rose 0.2 percent in the month. Year-on-year, total prices inched 1 tenth lower to 1.0 percent while the core inched 1 tenth higher to 2.2 percent. Nothing inspiring and nothing to make policy makers wonder whether they're behind the inflation curve. Yet there were two reports in the week that may be hinting at future pressure as producer prices posted a less-than-moderate 0.4 percent increase that includes gains for goods, which are being inflated by the ongoing climb in energy, and also gains for services where price traction hints perhaps at an uptick in industrial demand. The import & export price report showed even stronger gains but not any, however, for finished goods where prices, and by extension the outlook for consumer prices, are flat.
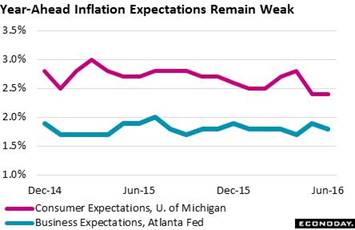 FOMC forecasters held their inflation targets steady in the June report, calling for a very slow rise to the 2 percent line for their favored measure, the PCE core which is currently running listless at 1.6 percent. Inflation expectations in the consumer sentiment report have definitely been making news, conceded by Yellen in her press conference who noted the downturn as a concern. Year-ahead expectations fell to 2.4 percent in May's sentiment report and have been holding there so far this month, down 4 tenths from the prior month. Year-ahead expectations on the business side, as tracked by the Atlanta Fed report, are down 1 tenth this month to 1.8 percent. If you want peace and quiet, stick to inflation data. FOMC forecasters held their inflation targets steady in the June report, calling for a very slow rise to the 2 percent line for their favored measure, the PCE core which is currently running listless at 1.6 percent. Inflation expectations in the consumer sentiment report have definitely been making news, conceded by Yellen in her press conference who noted the downturn as a concern. Year-ahead expectations fell to 2.4 percent in May's sentiment report and have been holding there so far this month, down 4 tenths from the prior month. Year-ahead expectations on the business side, as tracked by the Atlanta Fed report, are down 1 tenth this month to 1.8 percent. If you want peace and quiet, stick to inflation data.
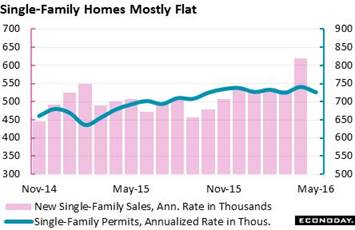 Housing is the place to be this year, where strength is based on the domestic consumer and ultimately on the strength of the jobs market. Housing data have generally been climbing but there has been a lot of misfires along the way. Housing starts slipped slightly in May though the year-on-year rate rose to nearly 10 percent, while permits in contrast popped higher in month but are in year-on-year reverse at more than 10 percent. But the most important component in the report, single-family homes, does show strength with starts running at plus 10.1 percent yearly though permits are well behind at only plus 2.2 percent. Sales of new homes, in data released last month, have been flat but they did jump in April which, if not anomaly, may be a new beginning. The new homes sector has been showing strength here and there and in total is trending higher which, for this economy, is actually a big highlight. Housing is the place to be this year, where strength is based on the domestic consumer and ultimately on the strength of the jobs market. Housing data have generally been climbing but there has been a lot of misfires along the way. Housing starts slipped slightly in May though the year-on-year rate rose to nearly 10 percent, while permits in contrast popped higher in month but are in year-on-year reverse at more than 10 percent. But the most important component in the report, single-family homes, does show strength with starts running at plus 10.1 percent yearly though permits are well behind at only plus 2.2 percent. Sales of new homes, in data released last month, have been flat but they did jump in April which, if not anomaly, may be a new beginning. The new homes sector has been showing strength here and there and in total is trending higher which, for this economy, is actually a big highlight.
 Concerns rule right now, not the least of which is Brexit and whether the structure of Europe is about to change. Safe-haven flows keep pushing into Treasuries where the yield on the 2-year note fell another 4 basis points in the week to, as the Fed might look it, an ever more accommodative 0.70 percent. Despite the Fed's rate hike in December and unceasing push for another rate hike, the 2-year yield is down 35 basis points so far this year. The 10-year yield, at 1.61 percent, is down 66 basis points. Acceptance of low yields speaks to expectations of weakness ahead, much like the FOMC's own projections. Low yields make holding gold, which doesn't pay a yield, more attractive. Gold rose 1.8 percent in the week and at $1,301 is not only right back over $1,300 again but is up 22.7 percent on the year. Low yields are also consistent with weakness in the dollar which on the dollar index fell a weekly 0.5 percent for a 4.7 percent year-to-date decline, a decline that sooner than later should be giving a lift to exports. Concerns rule right now, not the least of which is Brexit and whether the structure of Europe is about to change. Safe-haven flows keep pushing into Treasuries where the yield on the 2-year note fell another 4 basis points in the week to, as the Fed might look it, an ever more accommodative 0.70 percent. Despite the Fed's rate hike in December and unceasing push for another rate hike, the 2-year yield is down 35 basis points so far this year. The 10-year yield, at 1.61 percent, is down 66 basis points. Acceptance of low yields speaks to expectations of weakness ahead, much like the FOMC's own projections. Low yields make holding gold, which doesn't pay a yield, more attractive. Gold rose 1.8 percent in the week and at $1,301 is not only right back over $1,300 again but is up 22.7 percent on the year. Low yields are also consistent with weakness in the dollar which on the dollar index fell a weekly 0.5 percent for a 4.7 percent year-to-date decline, a decline that sooner than later should be giving a lift to exports.
| Markets at a Glance |
Year-End |
Week Ended |
Week Ended |
Year-To-Date |
Weekly |
|
2015 |
10-Jun-16 |
17-Jun-16 |
Change |
Change |
| DJIA |
17,425.03 |
17,865.34 |
17,675.16 |
1.4% |
-1.1% |
| S&P 500 |
2,043.94 |
2,096.07 |
2,071.22 |
1.3% |
-1.2% |
| Nasdaq Composite |
5,007.41 |
4,894.55 |
4,800.34 |
-4.1% |
-1.9% |
|
|
|
|
|
|
| Crude Oil, WTI ($/barrel) |
$37.40 |
$48.99 |
$48.08 |
28.6% |
-1.9% |
| Gold (COMEX) ($/ounce) |
$1,060.00 |
$1,277.50 |
$1,301.10 |
22.7% |
1.8% |
|
|
|
|
|
|
| Fed Funds Target |
0.25 to 0.50% |
0.25 to 0.50% |
0.25 to 0.50% |
0 bp |
0 bp |
| 2-Year Treasury Yield |
1.05% |
0.74% |
0.70% |
–35 bp |
–4 bp |
| 10-Year Treasury Yield |
2.27% |
1.64% |
1.61% |
–66 bp |
–3 bp |
| Dollar Index |
98.84 |
94.6 |
94.15 |
-4.7% |
-0.5% |
In her press conference, Yellen cited the possibility that the dismal payroll totals for May and April could be revised higher. Perhaps it would take sizable upward revisions along with an outsized gain for June, not to mention a lift in wages, to keep alive any chance for a rate hike in July, a meeting which otherwise looks more and more like another zombie from here.
The week starts on Wednesday with the FHFA housing price index followed by existing home sales, both of which are expected to show strength and offer confirmation of consumer health. Thursday's jobless claims report will cover the sample week of the employment report and offer the first hard clues whether a June rebound in payrolls can be expected. New home sales will round out the week's housing data on Thursday with Friday led by durable goods orders where forecasts vary widely but where trends have been flat. The week closes with consumer sentiment amid expectations that strength will be confirmed, at least for sentiment though inflation expectations are uncertain.
FHFA House Price Index for April
Consensus Forecast: +0.6%
Consensus Range: +0.5% to +0.8%
FHFA house price index has been rising at solid 0.5 percent to 0.7 percent clips since October and another 0.6 percent gain is expected for April. The year-on-year rate has been trending at or near 6.0 percent all year. Strength in home-price appreciation is of special importance in a low inflation, low wage-growth economy.
Existing Home Sales for May
Consensus Forecast, Annualized Rate: 5.570 million
Consensus Range: 5.350 to 5.680 million
Sales of existing homes posted a strong 1.7 percent gain in April and another strong gain of 2.2 percent is expected for May where the consensus is calling for a 5.570 million annualized rate. Prices have been rising but haven't yet driven more homes to market as lack of supply continues to hold back sales. Still a big gain is expected, one that along with April's gain would point to household strength.
Initial Jobless Claims for June 18 week
Consensus Forecast: 270,000
Consensus Range: 268,000 to 272,000
Initial jobless claims are expected to sink back tightly to trend, down 7,000 in the June 18 week to a consensus 270,000. Such a result would point to strength for the June employment report. Note that the June 18 week is also the sample week for the monthly employment report.
Manufacturing PMI, June Flash
Consensus Forecast: 51.0
Consensus Range: 50.0 to 52.0
The manufacturing PMI is expected to hold at a near standstill, barely above 50 at 51.0 for the June flash vs a final May reading of 50.7. Order growth in this report has been marginal with export orders and backlog orders in contraction. Production in May, for the first time this cycle, fell into outright contraction.
New Home Sales for May
Consensus Forecast, Annualized Rate: 565,000
Consensus Range: 500,000 to 610,000
New home sales are forecast to fall back 9.6 percent in May from April's giant 16.6 percent surge, to an annualized rate of 565,000. Despite the decline, the consensus rate for May would still be the second best of the recovery and next only to April. Lack of supply has been limiting sales of new homes, permits for which are rising at only a 5 percent pace.
Index of Leading Economic Indicators for May
Consensus Forecast, Month-to-Month Change: +0.2%
Consensus Range: -0.1% to +0.3%
The index of leading indicators is expected to rise a modest 0.2 percent in May, which would follow April's unusual 0.6 percent jump outside of which this indicator has been flat. May will get a boost from a 0.7 percent jump in housing permits offset, however, by a rise in the month's unemployment claims and a dip in the stock market.
Durable Goods Orders for May
Consensus Forecast, Month-to-Month Change: -0.7%
Consensus Range: -2.5% to +4.9%
Durable Goods Orders, Ex-Transportation
Consensus Forecast: 0.0%
Consensus Range: -0.8% to +0.5%
Durable orders have been up and down with forecasts no less so. The range for May orders is between a 2.5 percent drop and a 4.9 percent surge with the ex-transportation range also wide, at minus 0.8 to plus 0.5 percent. Monthly swings aside, trends in this report have been flat with capital goods, however, turning lower in what is a negative indication for business investment.
Consumer Sentiment Index, June Final
Consensus Forecast: 94.0
Consensus Range: 93.2 to 96.5
The consumer sentiment index jumped sharply and surprisingly in May and held on to the bulk of the gain in the June flash. Another small give back is expected for June's final reading, to a consensus 94.0 which, however, would only be 7 tenths below May. Gains in sentiment ultimately reflect confidence in the jobs market.
|
