|
Bond market bulls are suffering after FOMC minutes have suddenly revived chances for a rate hike at next month's meeting. The 2-year yield shot up an enormous 15 basis points in the week to 0.90 percent. This size of a spike is a reminder of October's move as the market then prepared for December's liftoff. But a rate hike in June won't depend on what the bond market does, but how the economy does.
 There is nothing in the week's data to come anywhere close to matching the prior week's surge in both retail sales and consumer sentiment. But the best news came early in the week and began to drive Treasury yields higher as consumer prices rose 0.4 percent in April for one the strongest showings of the cycle and the best since all the way back in February 2013. Energy did its part to back the gain, rising 3.4 percent in the month as gasoline jumped nearly 10 percent, from below $1.90 per gallon for regular to nearly $2.10. A similar contribution looks to be in store for May as the average this month is running at $2.27 in what would be another 10 percent gain. And gas will only go up as much as oil which also continues to go up, more than 3 percent higher this week to $48.50 for WTI which, based on its slope of ascent, may soon be testing $50. There is nothing in the week's data to come anywhere close to matching the prior week's surge in both retail sales and consumer sentiment. But the best news came early in the week and began to drive Treasury yields higher as consumer prices rose 0.4 percent in April for one the strongest showings of the cycle and the best since all the way back in February 2013. Energy did its part to back the gain, rising 3.4 percent in the month as gasoline jumped nearly 10 percent, from below $1.90 per gallon for regular to nearly $2.10. A similar contribution looks to be in store for May as the average this month is running at $2.27 in what would be another 10 percent gain. And gas will only go up as much as oil which also continues to go up, more than 3 percent higher this week to $48.50 for WTI which, based on its slope of ascent, may soon be testing $50.
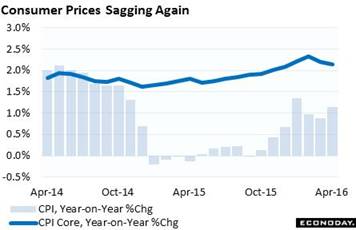
Yet outside of energy, it's hard to find much pressure at all. The year-on-year core rate, which is a central measurement for the Fed, edged lower for a second month and back toward the Fed's 2.0 percent goal. The overall CPI rate, which includes the effect of energy prices, did improve and is back over 1.0 percent, but further progress may be limited as coming year-on-year comparisons are going to be less easy. Service prices, boosted by medical care, have been leading the way, at a 2.7 percent year-on-year rate that has been inching steadily higher. But housing costs have been dead flat at 2.1 percent all year while growth in food costs has been below 1.0 percent. And the rise in gas prices isn't impressing the consumer much, based on the prior week's shocking 3 tenth decline in 1-year inflation expectations to a very low 2.5 percent. And inflationary pressures aren't very apparent in the global economy where European and Japanese policy makers are scrambling to boost prices. But perhaps the biggest factor of all for inflation -- worker pay -- hasn't been showing much life either, unable to move past the 2.5 percent line for average hourly earnings.
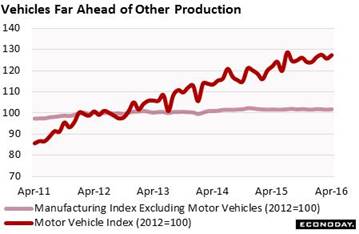 Another positive early in the week (and a negative one for bonds) came from industrial production which shot 0.7 percent higher in April for the strongest showing since November 2014. Strength was centered in a turnaround for utility production where volatility, however, is the norm. But there was also strength in the manufacturing component which rose a very solid 0.3 percent for its first gain since January. The gain for manufacturing was led once again by vehicle production where annual volume growth has held steadily in the mid-single-digit range, well above production excluding vehicles which has been right at zero for the last several years. The accompanying graph tracks the index readings for vehicle production (dark line which is climbing) against ex-vehicle production (light line which is going nowhere). Another positive early in the week (and a negative one for bonds) came from industrial production which shot 0.7 percent higher in April for the strongest showing since November 2014. Strength was centered in a turnaround for utility production where volatility, however, is the norm. But there was also strength in the manufacturing component which rose a very solid 0.3 percent for its first gain since January. The gain for manufacturing was led once again by vehicle production where annual volume growth has held steadily in the mid-single-digit range, well above production excluding vehicles which has been right at zero for the last several years. The accompanying graph tracks the index readings for vehicle production (dark line which is climbing) against ex-vehicle production (light line which is going nowhere).
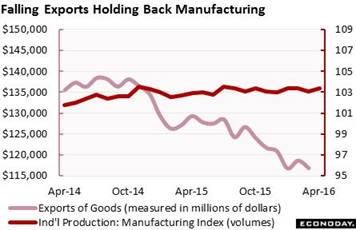 How long can the auto sector continue to contribute to manufacturing? Vehicle sales have been slowing over the past year, from mid-single-digit retail growth to low-single-digit growth. If vehicles slow, what other strength could give the sector a boost? Demand for energy equipment, despite the rise underway in oil prices, remains very weak as evidenced by the decline still underway in mining production, down 10 percent and accelerating. And exports have yet to show any benefit at all, at least yet, from the 3 to 4 percent depreciation this year in the dollar. The graph tracks manufacturing production against the dollar value of goods exports which has fallen very visibly since late 2014. Watch for one of the government's newest reports, the advance release for goods trade on Wednesday's calendar (May 25). How long can the auto sector continue to contribute to manufacturing? Vehicle sales have been slowing over the past year, from mid-single-digit retail growth to low-single-digit growth. If vehicles slow, what other strength could give the sector a boost? Demand for energy equipment, despite the rise underway in oil prices, remains very weak as evidenced by the decline still underway in mining production, down 10 percent and accelerating. And exports have yet to show any benefit at all, at least yet, from the 3 to 4 percent depreciation this year in the dollar. The graph tracks manufacturing production against the dollar value of goods exports which has fallen very visibly since late 2014. Watch for one of the government's newest reports, the advance release for goods trade on Wednesday's calendar (May 25).
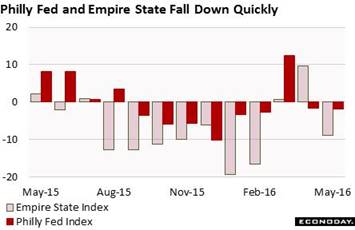 One of the biggest concerns facing the outlook right now is the fast reversals for Empire State and Philly Fed, the two most closely watched leading indications on the factory sector which both showed surprising weakness in their May editions. The Philly Fed index in March sprang miraculously to life, jumping over 10 for the first positive reading since August last year. And it was the month before that the Empire State index made its appearance over the zero line, at plus 0.62 to be exact, for its first positive reading since July last year. Empire State then extended the strength in April to a nearly 10 reading before, however, dumping nearly 20 points to minus 9.02. The Philly Fed threw the towel in the month before and, at minus 1.8 in May, is back in the contraction column for a second month in a row. The bursts of life in these indexes proved brief indeed. The effects of the lower dollar and rise in oil appear certain to help the factory sector, but just not yet. One of the biggest concerns facing the outlook right now is the fast reversals for Empire State and Philly Fed, the two most closely watched leading indications on the factory sector which both showed surprising weakness in their May editions. The Philly Fed index in March sprang miraculously to life, jumping over 10 for the first positive reading since August last year. And it was the month before that the Empire State index made its appearance over the zero line, at plus 0.62 to be exact, for its first positive reading since July last year. Empire State then extended the strength in April to a nearly 10 reading before, however, dumping nearly 20 points to minus 9.02. The Philly Fed threw the towel in the month before and, at minus 1.8 in May, is back in the contraction column for a second month in a row. The bursts of life in these indexes proved brief indeed. The effects of the lower dollar and rise in oil appear certain to help the factory sector, but just not yet.
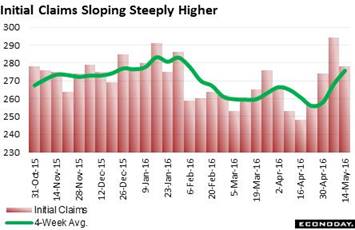 What bond yields didn't respond to was a not-so-hot jobless claims report where, outside of a 16,000 headline decline, details aren't very favorable. The decline in the May 14 week brought the level down to 278,000 which is remarkably low by historical standards — but it's not historical standards that matter. What matters is the comparison with April and whether the labor market is showing month-to-month strength or month-to-month weakness. The May 14 week is also the sample week for the May employment report and a comparison of the 278,000 level with the April 16 week, which was the sample week for the April employment report, shows a giant 30,000 increase. The difference in the 4-week average is also very large, at 15,000. These comparisons suggest that layoffs are on the rise which doesn't point to gains for May payrolls or to a dip in the unemployment rate. It also doesn't point to any increase in wage pressures. The Labor Department has not been citing any special factors though the Verizon strike of 40,000 communications workers may be a hidden wildcard that could be inflating this series and one that may begin to deflate the monthly employment report. Should the employment report for May, which is by far the single most important set of data between now and the June FOMC, prove weak, the talk of a June rate hike will be instantly and forever forgotten. What bond yields didn't respond to was a not-so-hot jobless claims report where, outside of a 16,000 headline decline, details aren't very favorable. The decline in the May 14 week brought the level down to 278,000 which is remarkably low by historical standards — but it's not historical standards that matter. What matters is the comparison with April and whether the labor market is showing month-to-month strength or month-to-month weakness. The May 14 week is also the sample week for the May employment report and a comparison of the 278,000 level with the April 16 week, which was the sample week for the April employment report, shows a giant 30,000 increase. The difference in the 4-week average is also very large, at 15,000. These comparisons suggest that layoffs are on the rise which doesn't point to gains for May payrolls or to a dip in the unemployment rate. It also doesn't point to any increase in wage pressures. The Labor Department has not been citing any special factors though the Verizon strike of 40,000 communications workers may be a hidden wildcard that could be inflating this series and one that may begin to deflate the monthly employment report. Should the employment report for May, which is by far the single most important set of data between now and the June FOMC, prove weak, the talk of a June rate hike will be instantly and forever forgotten.
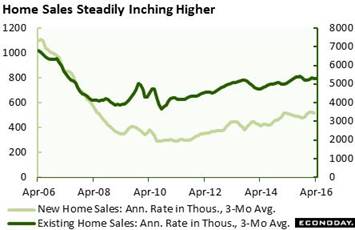 There's no danger right now that the housing sector is in a boom but it is growing steadily and, though only in the mid-single digits, is just about the hottest sector around right now. Sales of existing homes rose 1.7 percent in April and are up a very solid 6.0 percent from April last year. The annualized rate of 5.45 million is among the best of recent results. Prices are also up, with the median 5.0 percent higher in the month to $232,500 for a year-on-year gain of 6.3 percent. These rates aren't record breakers but, compared to everything else in the economy, they are definitely not bad. Special good news is that supply constraints may be lifting as gains in prices draw more homes to the market, totaling 2.14 million in April for a sudden 9.2 percent surge. Still, year-on-year inventory is down 3.6 percent which is a negative for sales. The new home side of the market has been showing a similar pattern, respectable gains that are being held back by lack of supply. The graph tracks the relative performance of existing home sales (dark line) and new home sales (light line). Existing home sales have moved from a mid 6 million rate over the span of the graph to a mid 5 million rate, but note the special weakness in new home sales, moving from over a 1 million rate in 2006 to half that now. Weakness in new homes means weakness for the construction sector and less strength for GDP. Watch for the April new home sales report on Tuesday's calendar, May 24. There's no danger right now that the housing sector is in a boom but it is growing steadily and, though only in the mid-single digits, is just about the hottest sector around right now. Sales of existing homes rose 1.7 percent in April and are up a very solid 6.0 percent from April last year. The annualized rate of 5.45 million is among the best of recent results. Prices are also up, with the median 5.0 percent higher in the month to $232,500 for a year-on-year gain of 6.3 percent. These rates aren't record breakers but, compared to everything else in the economy, they are definitely not bad. Special good news is that supply constraints may be lifting as gains in prices draw more homes to the market, totaling 2.14 million in April for a sudden 9.2 percent surge. Still, year-on-year inventory is down 3.6 percent which is a negative for sales. The new home side of the market has been showing a similar pattern, respectable gains that are being held back by lack of supply. The graph tracks the relative performance of existing home sales (dark line) and new home sales (light line). Existing home sales have moved from a mid 6 million rate over the span of the graph to a mid 5 million rate, but note the special weakness in new home sales, moving from over a 1 million rate in 2006 to half that now. Weakness in new homes means weakness for the construction sector and less strength for GDP. Watch for the April new home sales report on Tuesday's calendar, May 24.
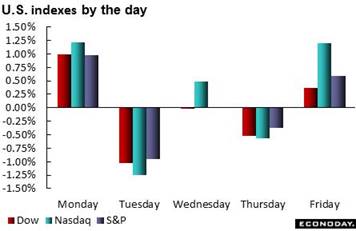 This week was bad enough for the bond bulls but what's in store in the coming week may be even worse. FOMC members are appearing in force, beginning on Monday and peaking on Friday with comments perhaps from Janet Yellen herself. But the minutes may have already done the job of lifting rates, giving members less motivation to sound hawkish. Just perhaps? The 10-year yield, like the 2-year yield, also jumped 15 basis points in the week to 1.85 percent. But unlike bonds, action in the stock market was limited. And higher rates made for only a modest 0.8 percent gain in the dollar index during the week. This week was bad enough for the bond bulls but what's in store in the coming week may be even worse. FOMC members are appearing in force, beginning on Monday and peaking on Friday with comments perhaps from Janet Yellen herself. But the minutes may have already done the job of lifting rates, giving members less motivation to sound hawkish. Just perhaps? The 10-year yield, like the 2-year yield, also jumped 15 basis points in the week to 1.85 percent. But unlike bonds, action in the stock market was limited. And higher rates made for only a modest 0.8 percent gain in the dollar index during the week.
| Markets at a Glance |
Year-End |
Week Ended |
Week Ended |
Year-To-Date |
Weekly |
|
2015 |
13-May-16 |
20-May-16 |
Change |
Change |
| DJIA |
17,425.03 |
17,535.32 |
17,500.94 |
0.4% |
-0.2% |
| S&P 500 |
2,043.94 |
2,046.61 |
2,052.32 |
0.4% |
0.3% |
| Nasdaq Composite |
5,007.41 |
4,717.68 |
4,769.56 |
-4.7% |
1.1% |
|
|
|
|
|
|
| Crude Oil, WTI ($/barrel) |
$37.40 |
$46.95 |
$48.50 |
29.7% |
3.3% |
| Gold (COMEX) ($/ounce) |
$1,060.00 |
$1,270.40 |
$1,252.56 |
18.2% |
-1.4% |
|
|
|
|
|
|
| Fed Funds Target |
0.25 to 0.50% |
0.25 to 0.50% |
0.25 to 0.50% |
0 bp |
0 bp |
| 2-Year Treasury Yield |
1.05% |
0.75% |
0.90% |
–15 bp |
15 bp |
| 10-Year Treasury Yield |
2.27% |
1.70% |
1.85% |
–42 bp |
15 bp |
| Dollar Index |
98.84 |
94.56 |
95.35 |
-3.5% |
0.8% |
FOMC members, back in April at least, voiced their determination to raise rates at the June FOMC on the prospect that second-quarter GDP would likely rebound. But much of the subsequent data are not pointing to a big rebound. April payroll growth proved soft at 160,000 and May isn't sizing up to be any stronger. And let's face it, talk is cheap. Remember back to the March minutes when the FOMC was talking up a phantom rate hike for the April FOMC?
It will be a week of Fedspeak, made more sensitive by the sudden shift toward a June rate hike. Seven speaking events are on tap, starting on Monday with three regional presidents and peaking on Friday with Fed chief Janet Yellen. Economic data will include new home sales on Tuesday and FHFA house price data on Thursday. Strength for both, which is expected, would lift the outlook for what has been a steady but less-than-robust housing sector. Factory data will include cross-border trade in goods and new orders for durable goods. Strength in exports and a rise in orders would help improve what has been a flat outlook for the sector. Consumer strength is the economy's mainstay and an upward revision to personal consumption expenditures is expected to boost the second estimate of first-quarter GDP, seen at plus 0.9 percent from an initial plus 0.5 percent. The final consumer sentiment reading for May ends the week and it will be hard to top this report's mid-month surge.
Manufacturing PMI, May Flash
Consensus Forecast: 51.0
Consensus Range: 50.5 to 51.5
The manufacturing PMI, like other leading indicators, has been giving soft signals. The flash for May, at a consensus 51.0, is expected to extend a trend of nearly flat readings. Modest strength in new orders was the biggest plus for April and should help keep the index over the 50 level in May. Export orders have been very weak and manufacturers in the sample have been working down their inventories as much as possible.
New Home Sales for April
Consensus Forecast, Annualized Rate: 523,000
Consensus Range: 510,000 to 530,000
New home sales have been flat near the 520,000 rate and little more than slight improvement is expected for April, at a consensus 523,000. Sales have been weak despite low mortgage rates and strength in the jobs market, and are being held back by lack of homes on the market. Prices have also been weak with the year-on-year rate, in contrast to prices for existing homes, in the negative column.
International Trade In Goods for April
Consensus Forecast, Month-to-Month Change: -$60.2 billion
Consensus Range: -$63.4 to -$57.5 billion
The trade deficit in goods, pushed higher by oil prices, is expected to widen to $60.2 billion in April from $56.9 billion in March. But the narrower gap in March did not reflect economic strength as both exports of goods and imports of goods fell, especially imports of consumer goods. The April report will offer the goods inputs into the monthly international trade report (released Friday, June 3).
FHFA House Price Index for March
Consensus Forecast: +0.5%
Consensus Range: +0.4% to +0.6%
FHFA house price index has been rising at solid 0.5 percent to 0.6 percent clips since October and another 0.5 percent gain is expected for March. The year-on-year rate, however, has not been keeping pace, moving slowly off the 6.0 percent line to 5.6 percent in the February report. Strength in home appreciation is of special importance in a low inflation, low wage-growth economy.
Durable Goods Orders for April
Consensus Forecast, Month-to-Month Change: +0.3%
Consensus Range: -0.6% to +1.3%
Durable Goods Orders, Ex-Transportation
Consensus Forecast: +0.4%
Consensus Range: +0.1% to +0.8%
Durable orders have been up and down month to month but flat on a trend basis. Orders are expected to rise a moderate 0.3 percent in April but the spread is wide, between minus 0.6 percent and plus 1.3 percent. Similar strength is also expected when excluding transportation which is expected to rise 0.4 percent. Capital goods data have also been flat, pointing to what are flat business expectations ahead. Still, strength tied to the decline in the dollar, which will help exports, and to higher oil prices, which will boost energy equipment, appear certain to give a lift to the factory sector, sooner than later.
Initial Jobless Claims for May 21 week
Consensus Forecast: 275,000
Consensus Range: 270,000 to 275,000
Initial jobless claims fell back sharply in the May 14 week to 278,000 and an incremental decline is expected for the May 21 week, at a consensus 275,000. Data in this report are at historic lows but have been trending higher and pointing at slowing gains for the May employment report.
Pending Home Sales for April
Consensus Forecast, Month-to-Month Change: +0.8%
Consensus Range: 0.0% to +1.2%
Existing home sales have been on the upswing, as indicated in advance by the pending home sales report which tracks contract signings. Pending sales for April are expected to post a very solid 0.8 percent gain following March's surprising 1.4 percent jump. Gains for pending sales would underscore the strength of the existing home market.
Real GDP, 1st Quarter, 2nd Estimate, Annualized Rate
Consensus Forecast: +0.9%
Consensus Range: +0.5% to +1.1%
GDP Price Index
Consensus Forecast: +0.7%
Consensus Range: +0.6% to +0.7%
The second estimate for first-quarter GDP is expected to come in at plus 0.9 percent for a 4 tenths gain from the initial reading. Personal consumption expenditures are expected to be revised higher in what would underscore early second-quarter strength for retail sales. Residential fixed investment, in another indication of consumer strength, is also expected to be revised higher. The GDP price index is seen holding at only 0.7 percent.
Consumer Sentiment, Final May
Consensus Forecast: 95.5
Consensus Range: 94.0 to 96.5
The consumer sentiment index shot higher in the mid-month May report, up nearly 7 points to 95.8 for the best reading since June last year. And forecasters expected the index to hold the gain, at a consensus 95.5. Strength for this index points to confidence in the jobs outlook.
|
