|
A few weeks ago I compared the housing sector to a tired albatross trying to get into the air. It now looks more like a wounded albatross. The week's housing data were decidedly mixed for a sector that is showing no lift at all going into the big Spring season. But not all the news is soft as the economy's central strength — the jobs market — continues to improve.
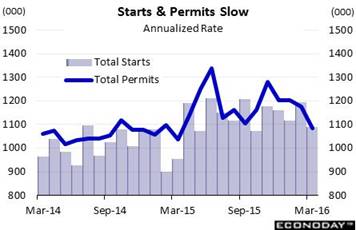 Tuesday's housing starts & permits report proved to be a big surprise, and not a pleasant one. Housing starts fell a very steep 8.8 percent in March to a 1.089 million annualized rate with permits showing similar weakness, down 7.7 percent to a nearly identical 1.086 million rate. Starts haven't been lower since October last year and, in a particular negative, permits haven't been this low since April last year. Weakness in permits points directly to weakness in starts which in turn points to weakness in construction spending and construction employment. Spring is the season that those in the housing sector count on but momentum, despite a strong jobs market and low mortgage rates, is definitely not building. Tuesday's housing starts & permits report proved to be a big surprise, and not a pleasant one. Housing starts fell a very steep 8.8 percent in March to a 1.089 million annualized rate with permits showing similar weakness, down 7.7 percent to a nearly identical 1.086 million rate. Starts haven't been lower since October last year and, in a particular negative, permits haven't been this low since April last year. Weakness in permits points directly to weakness in starts which in turn points to weakness in construction spending and construction employment. Spring is the season that those in the housing sector count on but momentum, despite a strong jobs market and low mortgage rates, is definitely not building.
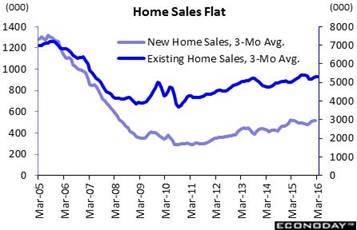 Not all the housing news is bad but even the good news, isn't really that great. Existing home sales rose more than expected in March, up 5.1 percent to a 5.330 million annualized rate that, however, fails to reverse a 7.3 percent monthly drop in February. And year-on-year growth, at only 1.5 percent, is decidedly unimpressive. Month-to-month sales data are volatile of course and should be smoothed out with a 3-month average. The accompanying graph compares the 3-month average for existing home sales (the dark blue line) with the 3-month average for new home sales (the light blue line). New home sales relative to existing home sales are down substantially from the peak of the boom in late 2005, from 15 percent of all home sales to only 9 percent now. And the 15 percent share was in a much larger market, an 8.5 million sales market vs today's market at 5.8 million. It's the lack of sales that ultimately explains the weakness in starts & permits. The housing market has been chilly this year, occasionally showing signs of strength but more times than not moving backwards. The new home sales report for March will kick off the coming week's calendar on Monday. Not all the housing news is bad but even the good news, isn't really that great. Existing home sales rose more than expected in March, up 5.1 percent to a 5.330 million annualized rate that, however, fails to reverse a 7.3 percent monthly drop in February. And year-on-year growth, at only 1.5 percent, is decidedly unimpressive. Month-to-month sales data are volatile of course and should be smoothed out with a 3-month average. The accompanying graph compares the 3-month average for existing home sales (the dark blue line) with the 3-month average for new home sales (the light blue line). New home sales relative to existing home sales are down substantially from the peak of the boom in late 2005, from 15 percent of all home sales to only 9 percent now. And the 15 percent share was in a much larger market, an 8.5 million sales market vs today's market at 5.8 million. It's the lack of sales that ultimately explains the weakness in starts & permits. The housing market has been chilly this year, occasionally showing signs of strength but more times than not moving backwards. The new home sales report for March will kick off the coming week's calendar on Monday.
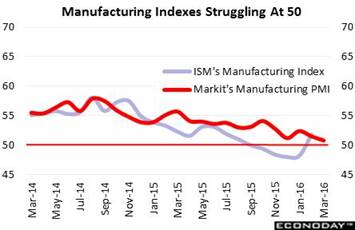 There were flashes of factory sector strength in March while the Empire State report for April was very solid, but there isn't any lightening at all in the latest reports. The Philly Fed manufacturing index, which had popped higher in March, edged back into contraction, to minus 1.6 in April, with new orders at zero. Employment moved deeply negative and inventories continued to contract in a telling sign that businesses are becoming increasingly defensive, perhaps. Also released was the manufacturing PMI, a private survey that is national in scope and holding just barely above breakeven 50, at 50.8 for the April flash. Export orders, despite the dollar's depreciation, are in contraction and respondents continue to report, despite recent gains in oil prices, weakness in energy equipment. These two areas, exports and energy, appear certain to turn higher sooner than later. The red line of the above graph tracks the manufacturing PMI which has been trending inevitably downward to 50, a make-or-break line that the ISM index has already fallen through but, in one of the sector's most solid flashes of strength, quickly jumped back above. Of special note this campaign season, the text of the April flash report, in a first of sorts compared with other reports, cites the nation's "political climate" and its relation to the economic outlook as a possible reason behind the weakness. There were flashes of factory sector strength in March while the Empire State report for April was very solid, but there isn't any lightening at all in the latest reports. The Philly Fed manufacturing index, which had popped higher in March, edged back into contraction, to minus 1.6 in April, with new orders at zero. Employment moved deeply negative and inventories continued to contract in a telling sign that businesses are becoming increasingly defensive, perhaps. Also released was the manufacturing PMI, a private survey that is national in scope and holding just barely above breakeven 50, at 50.8 for the April flash. Export orders, despite the dollar's depreciation, are in contraction and respondents continue to report, despite recent gains in oil prices, weakness in energy equipment. These two areas, exports and energy, appear certain to turn higher sooner than later. The red line of the above graph tracks the manufacturing PMI which has been trending inevitably downward to 50, a make-or-break line that the ISM index has already fallen through but, in one of the sector's most solid flashes of strength, quickly jumped back above. Of special note this campaign season, the text of the April flash report, in a first of sorts compared with other reports, cites the nation's "political climate" and its relation to the economic outlook as a possible reason behind the weakness.
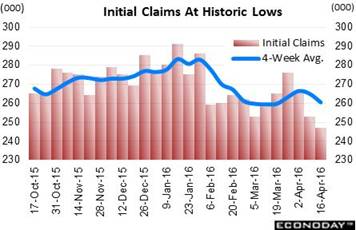 Against a backdrop of soft data, the labor market once again stands out as the economy's leading positive. Initial jobless claims fell 6,000 in the April 16 week to a much lower-than-expected 247,000 (tracked in the far right column of the graph). This is the lowest level since 1973, a comparison made more impressive given the much larger size of the civilian labor force, at 159.3 million now vs 89.0 million back then to be exact. The 4-week average for initial claims (the line in the graph) fell 4,500 to 260,500. Forecasters are focused on the April 16 week as it was the sample week for the April employment report and a comparison with the sample week of the March employment is positive, well at least mostly positive. The weekly level is down 12,000 but the 4-week average is up fractionally, but is still holding at a very low level. Continuing claims, in lagging data for the April 9 week, are favorable, down 39,000 to 2.127 million which is the lowest for this series since 2000. Against a backdrop of soft data, the labor market once again stands out as the economy's leading positive. Initial jobless claims fell 6,000 in the April 16 week to a much lower-than-expected 247,000 (tracked in the far right column of the graph). This is the lowest level since 1973, a comparison made more impressive given the much larger size of the civilian labor force, at 159.3 million now vs 89.0 million back then to be exact. The 4-week average for initial claims (the line in the graph) fell 4,500 to 260,500. Forecasters are focused on the April 16 week as it was the sample week for the April employment report and a comparison with the sample week of the March employment is positive, well at least mostly positive. The weekly level is down 12,000 but the 4-week average is up fractionally, but is still holding at a very low level. Continuing claims, in lagging data for the April 9 week, are favorable, down 39,000 to 2.127 million which is the lowest for this series since 2000.
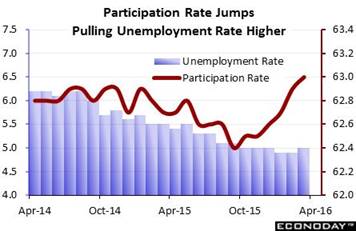 The fewer who are losing jobs, as indicated by the claims numbers, the more confident newcomers will be to enter the labor force and the more confident discouraged workers will be to re-enter the labor force. The big surprise so far in the labor data is the labor participation rate (red line in graph). This tracks not only those who have a job but also those actively looking for one. And the rate has been on a tear since late last year and, in a contrasting effect, has been applying an upward pull on the unemployment rate which ticked higher in March to 5.0 percent (column in the graph). The more people looking for a job, the higher the unemployment rate. There is also another contrary effect, at least if you are a policy maker, and that's the wage outlook. More workers looking for work will not be pulling wages any higher, and lack of wage growth remains a central question mark for the inflation outlook. Employment data for the month of April will be posted at the beginning of the May but judging by weekly jobless claims, we shouldn't be surprised to see another uptick in participation accompanied perhaps by another uptick in the unemployment rate. The fewer who are losing jobs, as indicated by the claims numbers, the more confident newcomers will be to enter the labor force and the more confident discouraged workers will be to re-enter the labor force. The big surprise so far in the labor data is the labor participation rate (red line in graph). This tracks not only those who have a job but also those actively looking for one. And the rate has been on a tear since late last year and, in a contrasting effect, has been applying an upward pull on the unemployment rate which ticked higher in March to 5.0 percent (column in the graph). The more people looking for a job, the higher the unemployment rate. There is also another contrary effect, at least if you are a policy maker, and that's the wage outlook. More workers looking for work will not be pulling wages any higher, and lack of wage growth remains a central question mark for the inflation outlook. Employment data for the month of April will be posted at the beginning of the May but judging by weekly jobless claims, we shouldn't be surprised to see another uptick in participation accompanied perhaps by another uptick in the unemployment rate.
 Big New York victories for Hillary Clinton and Donald Trump had no discernible effect on the markets unlike the failure of the producer talks in Qatar. No output freeze sent oil from over $42 to $38 before swinging up again and to nearly $44 by week's end. Nothing could stop oil, not even another build for weekly oil inventories. The gain in oil has been boosting energy shares and also general appetite for risk and helped give the Dow a small lift in the week to just over 18,000 at 18,003 at week's end. The Dow is now within easy striking distance of the current record at 18,272. The record was set in May last year and the Dow's approach is a reminder, despite all of the economic doom and gloom, of the market's building strength, strength that is making January's China-related flop yet another distant memory. More risk means less demand for safety and another week of declining demand and steepening trade for Treasuries where the 2-year yield rose a very sizable 9 basis points 0.82 percent with the 10-year yield up 14 basis points to 1.89 percent. The gain for the 10-year won't be a positive for the housing sector and is likely to hold back purchase applications in Wednesday's mortgage bankers' report. The dollar index rose slightly in the week to trim its year-to-date loss to 3.8 percent. Big New York victories for Hillary Clinton and Donald Trump had no discernible effect on the markets unlike the failure of the producer talks in Qatar. No output freeze sent oil from over $42 to $38 before swinging up again and to nearly $44 by week's end. Nothing could stop oil, not even another build for weekly oil inventories. The gain in oil has been boosting energy shares and also general appetite for risk and helped give the Dow a small lift in the week to just over 18,000 at 18,003 at week's end. The Dow is now within easy striking distance of the current record at 18,272. The record was set in May last year and the Dow's approach is a reminder, despite all of the economic doom and gloom, of the market's building strength, strength that is making January's China-related flop yet another distant memory. More risk means less demand for safety and another week of declining demand and steepening trade for Treasuries where the 2-year yield rose a very sizable 9 basis points 0.82 percent with the 10-year yield up 14 basis points to 1.89 percent. The gain for the 10-year won't be a positive for the housing sector and is likely to hold back purchase applications in Wednesday's mortgage bankers' report. The dollar index rose slightly in the week to trim its year-to-date loss to 3.8 percent.
| Markets at a Glance |
Year-End |
Week Ended |
Week Ended |
Year-To-Date |
Weekly |
|
2015 |
15-Apr-16 |
22-Apr-16 |
Change |
Change |
| DJIA |
17,425.03 |
17,897.46 |
18,003.54 |
3.3% |
0.6% |
| S&P 500 |
2,043.94 |
2,080.70 |
2,091.58 |
2.3% |
0.5% |
| Nasdaq Composite |
5,007.41 |
4,938.22 |
4,906.23 |
-2.0% |
-0.6% |
|
|
|
|
|
|
| Crude Oil, WTI ($/barrel) |
$37.40 |
$41.61 |
$43.74 |
17.0% |
5.1% |
| Gold (COMEX) ($/ounce) |
$1,060.00 |
$1,231.15 |
$1,234.17 |
16.4% |
0.2% |
|
|
|
|
|
|
| Fed Funds Target |
0.25 to 0.50% |
0.25 to 0.50% |
0.25 to 0.50% |
0 bp |
0 bp |
| 2-Year Treasury Yield |
1.05% |
0.73% |
0.82% |
-23 bp |
9 bp |
| 10-Year Treasury Yield |
2.27% |
1.75% |
1.89% |
-38 bp |
14 bp |
| Dollar Index |
98.84 |
94.72 |
95.06 |
-3.8% |
0.4% |
If you can only have one strength, the labor market is by far the best place to have it. But the jobs strength has yet to drive up wages which looks more and more like a necessary pre-condition for inflation to build. The factory sector is still flat and the lack of punch in housing data is difficult to explain away, especially given this year's mild temperatures which should be giving all the data some help. Policy makers won't have any trouble taking no action at the coming FOMC, likely focusing attention instead on the possibility of a rate hike at the June meeting.
The story of the first-quarter will have been told after this week's deluge. GDP is out on Thursday and the Econoday consensus is calling for a modest 0.7 percent rise in what would be the softest result since the first quarter last year. The FOMC will post its statement the day before but, given the flat conditions, no action is expected in a statement that may try to talk up chances for a June hike instead. Housing data are heavy and include Case-Shiller prices which are expected to be mixed. And factory data are also heavy, led by durable goods orders which are expected to show a bounce. The week ends with the quarterly employment cost report where pressure, which is expected, could finally turn up the heat on the wage-inflation outlook.
New Home Sales for March
Consensus Forecast, Annualized Rate: 522,000
Consensus Range: 500,000 to 532,000
New home sales have held near a 500,000 annualized pace since first approaching the rate in late 2014, this despite high levels of employment and low mortgage rates where the 30-year is still below 4 percent. The number of new homes coming into the market has been improving but is still lagging and holding down sales. Prices, however, are low and probably not holding down sales, showing only marginal sub-3 percent appreciation in this report. Forecasters see new homes holding near prior rates, up slightly to a 522,000 annualized rate for March which would follow last week's improvement in existing home sales to a 5.330 million rate.
Dallas Fed Manufacturing Index for April
Consensus Forecast: -9.0
Consensus Range: -11.4 to -8.0
The Dallas Fed general activity index showed some life in March and a little more is expected for April where the consensus is at minus 9.0. Stuck in contraction for 15 straights, the index did improve by 18 points in March to minus 13.6, a still deeply negative reading for a region getting mauled by the weakness in energy prices.
Durable Goods Orders for March
Consensus Forecast, Month-to-Month Chg: +1.6%
Consensus Range: 0.0% to +3.6%
Durable Goods Orders, Ex-Transportation
Consensus for February: +0.5%
Consensus Range: +0.2% to +1.2%
The dollar may be depreciating and oil prices may be stabilizing, but they have done very little — at least so far — to hold up durable goods orders which fell a steep 2.8 percent in February including a very weak 1.0 percent decline when excluding transportation equipment (and related month-to-month volatility in aircraft orders). Forecasters do see a bounce for March, at plus 1.6 percent for the main headline and at plus 0.5 percent for ex-transportation orders. Readings for core capital goods orders, including both orders and shipments, proved very weak in February and a lack of rebound in March would point to further erosion in business investment and continued weakness in productivity growth. Still, strength tied to the decline in the dollar, which will help exports, and to higher oil prices, which will boost energy equipment, appear certain to give a lift to the factory sector, sooner than later.
Case-Shiller, 20-City Adjusted Index for February
Consensus Forecast, Month-to-Month Change: +0.7%
Consensus Range: +0.6% to +1.0%
Case-Shiller, 20-City Unadjusted Index
Consensus Forecast, Year-to-Year Change: +5.5%
Consensus Range: +5.3% to +5.9%
February's gain of 0.4 percent for the FHFA house price index was very soft but forecasters see much more strength for Case-Shiller, at a consensus 0.7 percent for the adjusted 20-city index. But the year-on-year rate is expected to move down, not up, 2 tenths lower to plus 5.5 percent and below FHFA's 5.6 percent. Flat or not, home-price appreciation is still in the plus column and, given weakness in wages, is still a major key to household wealth this year.
Consumer Confidence Index For April
Consensus Forecast: 96.0
Consensus Range: 92.5 to 98.1
The University of Michigan's consumer sentiment index broke lower in mid-April and no improvement is expected for the April edition of the Conference Board's consumer confidence index which forecasters see down 2 tenths at a consensus 96.0. Lack of wage traction is a definite negative for consumer spirits and the political climate may also be one. Inflation expectations, like in other reports, are very subdued and have been a subject of top concern for Federal Reserve policy makers who are trying to lift prices. Spring is a key season for the economy and weakness in confidence won't be lifting expectations for the consumer or housing sectors.
Richmond Fed Manufacturing Index for April
Consensus Forecast: 12
Consensus Range: 10 to 14
The Richmond Fed's manufacturing index, which like other regional Fed surveys, had been in a long run of deep contraction, that is until March when it bolted to plus 22 from February's minus 4 for the greatest month-to-month surge in the report's 23-year history. New orders, perhaps getting a boost from exports and energy demand, surged in March which is a strongly positive signal for future activity. Econoday's consensus is calling for a plus 12 reading for April, down 10 points from March but still very solid.
International Trade In Goods for March
Consensus Forecast, Month-to-Month Change: -$62.6 billion
Consensus Range: -$63.9 to -$58.0 billion
The trade deficit in goods is expected to narrow to $62.6 billion in March vs a $64.7 billion deficit in February. Though wide, the deficit does show gains for exports which, though a negative for GDP, are otherwise a big plus for the economy and specifically for factory jobs. Exports of goods rose 1.4 percent in February and 2.0 percent in January and a similar gain for March would suggest that this year's depreciation in the dollar is beginning to give exporters some lift. The import side offers clues on domestic demand which, though rising in February, did fall back in January.
Pending Home Sales for March
Consensus Forecast, Month-to-Month Change: +0.5%
Consensus Range: 0.0% to +2.7%
Existing home sales have been very soft but improving, as consistently indicated in advance by the pending home sales report. This report for March is expected to rise a solid 0.5 percent in what would be a second straight positive showing. Still, sales trends have been soft, reflecting no better than moderate price appreciation which has not been strong enough to attract new supply into the market.
Federal Funds Rate Target for April 16 & 17 Meeting:
Consensus Forecast, Midpoint: 0.375%
Consensus Range, Midpoint: 0.325% to 0.375%
The Federal funds rate target is expected to remain unchanged at a midpoint of 0.375 percent between a range 0.25 to 0.50 percent, where it was set at the December FOMC. Though some FOMC members had been vocal in the possibility of an April rate hike, dovish comments from Janet Yellen, who is urging caution, as well as a run of soft economic data, specifically consumer data, have wiped out any chance for a move at this meeting. Continued concern over the global economy as well as lack of inflation pressures are likely themes for the statement which may, nevertheless, still underscore the possibility of a rate hike at the June FOMC.
Real GDP, 1st Quarter, 1st Estimate, Annualized Rate
Consensus Forecast: +0.7%
Range Forecast: +0.1% to +1.1%
GDP Price Index
Consensus Forecast: +0.5%
Consensus Range: +0.4% to +1.1%
The first estimate for first-quarter GDP is expected to come in at only plus 0.7 percent in what would be the weakest result since plus 0.6 percent in the first-quarter last year. But unlike last year, this year's first quarter was not hit by severe weather which underscores how soft the quarter likely was. Consumer spending, though soft, may improve slightly while residential investment, which has been strong, may slow. Inventories are expected to pull down GDP as businesses destocked. Net exports may also be a negative. The GDP price index is expected to further soften, to only plus 0.5 percent from 0.9 percent in the fourth quarter.
Initial Jobless Claims for April 23 week
Consensus Forecast: 260,000
Consensus Range: 240,000 to 264,000
Initial jobless claims moved lower in the first two weeks of April, to 247,000 in the April 16 week for an historic low and a positive indication on April employment. Initial claims for the April 23 week are expected to bounce higher, up 13,000 to 260,000. Data for continuing claims in this report will track the April 16 week and offer their own sample-week comparison with the coming April employment report.
Services PMI for April, Flash
Consensus Forecast: 52.0
Consensus Range: 51.3 to 52.2
The services PMI has been very soft, running near the breakeven in 50 level in what may be an ominous indication for the U.S. economy. Growth in new orders were extremely soft in the March report, at their lowest point in the 6-1/2 year history of the report. Backlog orders were also down as was confidence in the outlook, yet employment was still a positive, at least it was for March. Price data, as in other reports, have been subdued. March's final reading was 51.3 with the March flash at 51.0. Forecasters see some strength for the April flash, with the consensus at 52.0.
Personal Income for March
Consensus Forecast, Month-to-Month Change: +0.3%
Consensus Range: +0.2% to +0.4%
Personal Spending
Consensus Forecast: +0.2%
Consensus Range: 0.0% to +0.3%
PCE Price Index
Consensus Forecast: +0.1%
Consensus Range: 0.0% to +0.2%
Core PCE Price Index
Consensus Forecast: +0.1%
Consensus Range: 0.0% to +0.2%
This report in February was the shock of the quarter, as personal spending inched up only fractionally and a big gain in January was revised almost completely away. And, despite another likely uptick on service spending, not much more is expected with the Econoday consensus at plus 0.2 percent, held down especially by weak vehicle sales. Personal income, which only edged up in February, is expected to rise a solid 0.3 percent in March. This report also tracks the Federal Reserve's central policy rate for inflation, the core PCE price index which held unchanged at 1.7 percent in February. Forecasters see the index inching only 0.1 percent higher in March which would likely pull down the year-on-year rate to 1.5 percent and further away from the Federal Reserve's 2.0 percent target.
Employment Cost Index for 1st Quarter
Consensus Forecast, Quarter-to-Quarter Change: +0.6%
Consensus Range: +0.5% to +0.9%
The importance of the employment cost index to policy makers is hard to exaggerate with its results helping to shape their expectations on wage inflation, one of the most sensitive topics on the economy. This index showed solid 0.6 percent gains in both the third and fourth quarters and another is expected for the first quarter. Wage inflation has yet to make its appearance but this report, if it hits expectations and especially high expectations, would heat up the talk.
Chicago PMI for April
Consensus Forecast: 53.4
Consensus Range: 52.0 to 54.2
The Chicago PMI is expected to come in at 53.4 in April which would be little changed from 53.6 in March. But this report, up one month and down the next, is extremely volatile as the last four results have fallen outside Econoday's consensus range. But March's results do point to strength for April, specifically gains for both new orders and backlog orders. Production and employment were also strong. This report tracks both the manufacturing and non-manufacturing sectors of the Chicago economy.
Consumer Sentiment, April Final
Consensus Forecast: 90.4
Consensus Range: 90.0 to 91.5
The consumer sentiment index fell back sharply in the mid-month flash, down 1.3 points to an 89.7 level that was more than 2 points below expectations. Weakness was centered in the expectations component which points to emerging doubts over future job and income prospects. Inflation expectations are another key reading in this report with the 5-year outlook, in another negative reading, down 2 tenths to 2.5 percent. A small bounce back to 90.4 is expected for the final April report.
|
