|
Consumer strength offsetting industrial weakness is still the story, though strength in the former is easing while weakness in the latter is increasing. And it was global factors that were underscored by the FOMC whose January statement is definitely not raising expectations for the nation's growth. But close to home, there is good news. Let's sort our way through a packed week.
 FOMC policy makers warned us on Wednesday that growth slowed into year end. And sure enough it did. Friday's GDP headline for the fourth quarter came in at a very soft 0.7 percent annualized rate, well down from 2.0 percent in the third quarter. A reduction in inventory investment, pointing to a defensive outlook among businesses and which the FOMC also predicted on Wednesday, pulled back GDP by 0.5 percentage points. But there are many pluses to slowing inventory expansion which makes for leaner conditions and greater stability for future production and employment. But definitely not a plus is weakness for exports which pulled down GDP by 0.3 percentage points. FOMC policy makers warned us on Wednesday that growth slowed into year end. And sure enough it did. Friday's GDP headline for the fourth quarter came in at a very soft 0.7 percent annualized rate, well down from 2.0 percent in the third quarter. A reduction in inventory investment, pointing to a defensive outlook among businesses and which the FOMC also predicted on Wednesday, pulled back GDP by 0.5 percentage points. But there are many pluses to slowing inventory expansion which makes for leaner conditions and greater stability for future production and employment. But definitely not a plus is weakness for exports which pulled down GDP by 0.3 percentage points.
 The clear positive in GDP is the nation's consumer. Personal consumption, the dark column in the graph, rose at a very solid 2.2 percent annualized rate in the fourth quarter. This component, unlike nonresidential investment, has risen in every quarter since fourth-quarter 2009. Nevertheless, the consumer is slowing. The 2.2 percent rise compares with a 3.0 percent average over the last two years. Slowing, however, in nonresidential investment is steeper. Investment here fell 1.8 percent in the quarter for the first contraction since third-quarter 2012. This reading, a central one for business investment, has averaged plus 4.2 percent over the past two years which underscores the quarter's sudden weakness. But taking a step back, nonresidential investment, at 14 percent of the nation's $16.4 trillion economy, is a much a smaller component than personal consumption — which is 68 percent of the economy. Steady consumer growth, even at a modest rate, could continue to offset the export factor. The clear positive in GDP is the nation's consumer. Personal consumption, the dark column in the graph, rose at a very solid 2.2 percent annualized rate in the fourth quarter. This component, unlike nonresidential investment, has risen in every quarter since fourth-quarter 2009. Nevertheless, the consumer is slowing. The 2.2 percent rise compares with a 3.0 percent average over the last two years. Slowing, however, in nonresidential investment is steeper. Investment here fell 1.8 percent in the quarter for the first contraction since third-quarter 2012. This reading, a central one for business investment, has averaged plus 4.2 percent over the past two years which underscores the quarter's sudden weakness. But taking a step back, nonresidential investment, at 14 percent of the nation's $16.4 trillion economy, is a much a smaller component than personal consumption — which is 68 percent of the economy. Steady consumer growth, even at a modest rate, could continue to offset the export factor.
 The advance reading of the fourth-quarter GDP report includes estimates for some December data including trade data. The goods portion of the December trade report was also released on Friday and points to widening for the total trade gap, the result of extending weakness in exports. Pressured by weak foreign demand made weaker by the continued strengthening of the dollar, exports of goods have been moving steadily downward. Goods exports fell 1.0 percent to a monthly $120.2 billion in December for a year-on-year decline of 10.4 percent. Exports of foods were once again weak as were exports of capital goods, declines that are the result of weak industrial demand overseas. Some of this export trouble, but only some, is being offset by steady foreign demand for exports of U.S. services, though this is a much smaller category. Much of the trouble is the result of the ever strengthening dollar. The graph traces the slope of the trade-weighted dollar which is currently tracking at another gain in January, of about 1 percent. The Fed plans on withdrawing stimulus while other central banks are planning on adding further stimulus, a policy divergence that inevitably points to relative strength for the dollar and further trouble for exports. For the economy in general, domestic consumer demand may continue to pull things forward, but industrial demand isn't helping it along. The advance reading of the fourth-quarter GDP report includes estimates for some December data including trade data. The goods portion of the December trade report was also released on Friday and points to widening for the total trade gap, the result of extending weakness in exports. Pressured by weak foreign demand made weaker by the continued strengthening of the dollar, exports of goods have been moving steadily downward. Goods exports fell 1.0 percent to a monthly $120.2 billion in December for a year-on-year decline of 10.4 percent. Exports of foods were once again weak as were exports of capital goods, declines that are the result of weak industrial demand overseas. Some of this export trouble, but only some, is being offset by steady foreign demand for exports of U.S. services, though this is a much smaller category. Much of the trouble is the result of the ever strengthening dollar. The graph traces the slope of the trade-weighted dollar which is currently tracking at another gain in January, of about 1 percent. The Fed plans on withdrawing stimulus while other central banks are planning on adding further stimulus, a policy divergence that inevitably points to relative strength for the dollar and further trouble for exports. For the economy in general, domestic consumer demand may continue to pull things forward, but industrial demand isn't helping it along.
 The decline in capital goods exports was echoed in the week by a major decline in orders for core capital goods, down 4.3 percent to a monthly $65.9 billion. This is the lowest level, as seen in the bars on the graph, since October 2013. The result contributed to an even more severe 5.1 percent plunge in total durable orders to a monthly $225.4 billion, the lowest since February last year. A monthly downswing in aircraft orders led the contraction but orders for motor vehicles were also down, in a reminder that consumer demand was waning at year end. Export-intensive industries showed special weakness including machinery and communications equipment. Other readings included a 0.5 percent drop in total unfilled orders, which is a decline that does not point to a good start for the 2016 industrial economy. The decline in capital goods exports was echoed in the week by a major decline in orders for core capital goods, down 4.3 percent to a monthly $65.9 billion. This is the lowest level, as seen in the bars on the graph, since October 2013. The result contributed to an even more severe 5.1 percent plunge in total durable orders to a monthly $225.4 billion, the lowest since February last year. A monthly downswing in aircraft orders led the contraction but orders for motor vehicles were also down, in a reminder that consumer demand was waning at year end. Export-intensive industries showed special weakness including machinery and communications equipment. Other readings included a 0.5 percent drop in total unfilled orders, which is a decline that does not point to a good start for the 2016 industrial economy.
 And the early indications on January are, on net, not favorable. The Empire State report, released earlier this month, posted one of its most negative readings yet as did the Dallas Fed and Kansas City Fed, two reports where energy-related contraction is agonizingly apparent. The Dallas general activity index came in at minus 34.6 with new orders and unfilled orders falling into deep contraction. The Kansas City index, at minus 9, posted its ninth contraction in 10 months with new orders and unfilled orders also in deep contraction. Not all reports, however, are pointing to a January plunge. The results from the Philly Fed were respectable while the Chicago PMI absolutely surged, moving from deep contraction in December to strong growth in January. Chicago, however, is often volatile and covers the service sector as well as manufacturing. For manufacturing, it's contraction in the energy sector, together with weak exports, that may now be pushing the sector into an accelerated breakdown, at least that's the concern. And the early indications on January are, on net, not favorable. The Empire State report, released earlier this month, posted one of its most negative readings yet as did the Dallas Fed and Kansas City Fed, two reports where energy-related contraction is agonizingly apparent. The Dallas general activity index came in at minus 34.6 with new orders and unfilled orders falling into deep contraction. The Kansas City index, at minus 9, posted its ninth contraction in 10 months with new orders and unfilled orders also in deep contraction. Not all reports, however, are pointing to a January plunge. The results from the Philly Fed were respectable while the Chicago PMI absolutely surged, moving from deep contraction in December to strong growth in January. Chicago, however, is often volatile and covers the service sector as well as manufacturing. For manufacturing, it's contraction in the energy sector, together with weak exports, that may now be pushing the sector into an accelerated breakdown, at least that's the concern.
 But there is some undeniably good news on the economy, and that's home prices. Year-on-year appreciation in both the FHFA and Case-Shiller indexes has been steady and tracking near 6.0 percent. This may not sound that great but when prices everywhere else are flat or down and with average hourly earnings up only 2.5 percent, 6.0 percent actually gets the gold medal! The West, as it usually is, is out in front when it comes to home prices with the Mountain and Pacific regions at 10.0 and 8.6 percent respectively in FHFA data and Portland, San Francisco and Denver all at roughly 11.0 percent in Case-Shiller data. These gains, however, aren't guaranteed to last. Home sales have been uneven with new supply, both for new and existing homes, very slow to come to the market. Freddie Mac sees price appreciation slowing to 4.4 percent this year followed by 3.5 percent in 2017. But there is some undeniably good news on the economy, and that's home prices. Year-on-year appreciation in both the FHFA and Case-Shiller indexes has been steady and tracking near 6.0 percent. This may not sound that great but when prices everywhere else are flat or down and with average hourly earnings up only 2.5 percent, 6.0 percent actually gets the gold medal! The West, as it usually is, is out in front when it comes to home prices with the Mountain and Pacific regions at 10.0 and 8.6 percent respectively in FHFA data and Portland, San Francisco and Denver all at roughly 11.0 percent in Case-Shiller data. These gains, however, aren't guaranteed to last. Home sales have been uneven with new supply, both for new and existing homes, very slow to come to the market. Freddie Mac sees price appreciation slowing to 4.4 percent this year followed by 3.5 percent in 2017.
 Jobs, where improvement is described as "strong" and "continuing," were the big mainliner in the FOMC statement. Yet slowing seems very likely for the labor market. The Econoday consensus for January non-farm payrolls is 188,000 which would be well down from December's very strong 292,000. It would also be well down against the 3-month average which is at 284,000. Much of the January call is based on the unemployment side of the labor market where strength appears to be easing as both initial and continuing claims are on the rise. Claims data are posted weekly and offer a chance to compare sample weeks of the monthly employment report. Initial claims show a very large rise to 294,000 in the January sample week from 272,000 in the December sample week. Continuing claims, at 2.268 million in the graph above, rose a steep 73,000 from the December week. Claims hit their lows late last year and have since been on the climb, pointing to more layoffs and longer job searches. Jobs, where improvement is described as "strong" and "continuing," were the big mainliner in the FOMC statement. Yet slowing seems very likely for the labor market. The Econoday consensus for January non-farm payrolls is 188,000 which would be well down from December's very strong 292,000. It would also be well down against the 3-month average which is at 284,000. Much of the January call is based on the unemployment side of the labor market where strength appears to be easing as both initial and continuing claims are on the rise. Claims data are posted weekly and offer a chance to compare sample weeks of the monthly employment report. Initial claims show a very large rise to 294,000 in the January sample week from 272,000 in the December sample week. Continuing claims, at 2.268 million in the graph above, rose a steep 73,000 from the December week. Claims hit their lows late last year and have since been on the climb, pointing to more layoffs and longer job searches.
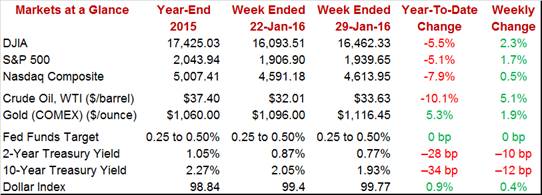
 The stock market had a good week with the Dow up 2.3 percent and down only 5.5 percent so far on the year. Oil also made a comeback, up 5.1 percent on the week and nearing $34 for WTI. Having a really good week was the U.S. Treasury market where, during a time when the Fed is positioned to raise rates, yields instead are falling fast. The 2-year yield fell 10 basis points in the week to 0.77 percent and is down 28 basis points on the year. The 10-year, under 2.0 percent at 1.93 percent, fell 12 basis points on the week for a 34 basis point decline. And this buying has all been compressed into a single month. But these rates are at least in the plus column, in contrast to those elsewhere including in Europe where 2-year rates are in the negative column. The stock market had a good week with the Dow up 2.3 percent and down only 5.5 percent so far on the year. Oil also made a comeback, up 5.1 percent on the week and nearing $34 for WTI. Having a really good week was the U.S. Treasury market where, during a time when the Fed is positioned to raise rates, yields instead are falling fast. The 2-year yield fell 10 basis points in the week to 0.77 percent and is down 28 basis points on the year. The 10-year, under 2.0 percent at 1.93 percent, fell 12 basis points on the week for a 34 basis point decline. And this buying has all been compressed into a single month. But these rates are at least in the plus column, in contrast to those elsewhere including in Europe where 2-year rates are in the negative column.
Global risks are this year's theme and they risk pulling the nation lower, unless of course the U.S. consumer, boosted perhaps by rising household wealth and perhaps even by higher wages, begins to spend in force and, in turn, help the global economy out of its rut. And there was one report last week that is hinting at strength, the overlooked employment cost index where near-term pressure on employers is rising which in turn hints at future wage gains. Still, year-on-year rates for the ECI remain no stronger than 2 percent. Slow demand is part of the deflation story and unless the Fed starts talking things up, expectations for a rate hike at the March FOMC aren't going to build any.
Economic growth is soft and employment growth may be slowing. A solid but unspectacular employment report is expected for Friday with the Econoday nonfarm consensus at 188,000. Still, strength at this level is respectable and could revive talk of a rate hike at the March FOMC. The week will begin with an ISM update on the manufacturing sector where, hit by weak exports and a weak energy sector, a third month of contraction is expected. Construction, in contrast, has been a plus for the economy with the latest spending data also to be posted on Monday. And, perhaps the most consistently strong of any indicator and reflecting the strength of the domestic economy — the ISM non-manufacturing report — will be posted on Wednesday. Thursday will see productivity and costs, a report where low growth is taking a toll, and international trade on Friday where both imports and especially exports have been slowing.
The core PCE price index is the Fed's central inflation reading and Econoday expectations are not looking for much of an increase, calling for a 0.1 percent gain in December. Personal income and personal spending are both expected to rise, at a respectable 0.3 percent for income but at only 0.1 percent for spending with the latter reflecting what turned out to be a flat December for holiday spending.
Personal Income, M/M Chg - Consensus for December: +0.3%
Range: +0.0% to +0.5%
Personal Spending, M/M Chg - Consensus for December: +0.1%
Range: +0.0% to +0.5%
PCE Price Index, M/M Chg - Consensus for December: 0.0%
Range: -0.1% to +0.1%
Core PCE Price Index M/M Chg - Consensus for December: +0.1%
Range: +0.1% to +0.2%
The flash January manufacturing PMI improved by a solid 1-1/2 points to a 52.7 level that is, however, on the soft side for this report which typically runs hotter than the ISM. New orders firmed on strength in domestic demand, offsetting another month of weakness for exports. Backlogs also stabilized in the flash report. Other readings included a gain for production but slowing for job creation. A 1 tenth dip back to 52.6 is expected for the final January reading.
Manufacturing PMI, Final - Consensus Forecast for January: 52.6
Range: 51.5 to 52.7
The ISM manufacturing index skidded into the sub-50 zone late last year and isn't expected to pop back over in January with Econoday forecasters calling for 48.3. December's 48.2 and November's 48.6 were two of the three weakest months of the recovery for this indicator and none of the 16 forecasters for this report see anything close to 50 in January with the high estimate at only 49.3. New orders have been in contraction with backlog orders in deep contraction. And ISM's sample has been describing inventories as too high in what points to a lack of confidence in the business outlook. This report is closely watched and a third straight sub-50 reading would definitely raise talk of another unfavorable year for the factory sector.
ISM Manufacturing Index - Consensus Forecast for January: 48.3
Range: 47.0 to 49.3
Construction spending had been a strength for the economy until late last year, falling November's 0.4 percent with downward revisions cutting sharply into October and September gains. The Econoday consensus is calling for a respectable rebound for December, at a consensus plus 0.6 percent. Housing and construction have been showing moderately positive trends, good enough to contribute to overall economic growth.
Construction Spending, M/M Chg - Consensus Forecast for December: +0.6%
Range: +0.3% to +1.3%
Motor vehicle sales, which were a strong contributor to economic growth through most of last year, began to hold down retail sales during the fourth quarter, which in turn pulled down related production in the factory sector. Unit sales peaked at over 18 million units during the third quarter but have since been moving back to 17 million. Sales in January are expected to firm to a 17.5 million annualized rate from what was a disappointing 17.3 million in December.
Total Vehicle Sales, Annual Rate - Consensus Forecast for January: 17.5 million
Range: 16.5 to 17.8 million
North American-Made Vehicle Sales, Annual Rate - Consensus for Jan.: 13.6 million
Range: 13.3 to 14.0 million
ADP's private payroll tally doesn't always accurately predict the outcome of the monthly employment report but it certainly did in December, calling for an outsized gain that proved to be correct. Less dramatic strength is seen for the January labor market where the consensus for ADP is 190,000.
ADP, Private Payrolls - Consensus Forecast for January: 190,000
Range: 160,000 to 219,000
The services PMI had been one of the most solid and consistent indicators on the calendar but has begun to slow. The Econoday consensus for the final January reading is 53.7, unchanged from the flash and down 6 tenths from December. Growth is as slow as it's been in a year for this indicator, reflecting cutbacks in the energy sector and uncertainty over the economic outlook.
Services PMI - Consensus Forecast for January, Final: 53.7
Range: 53.5 to 54.8
The ISM non-manufacturing index had been running very hot, near 60 before slowing to what are still very solid readings in the mid-50s. The Econoday consensus is calling for stable strength in January, at 55.5. New orders have been very strong as has employment in this report. And unlike ISM's manufacturing sample which has been cutting back inventories, ISM's non-manufacturing sample has been building inventories and pointing to confidence in the business outlook.
ISM Non-Manufacturing Index - Consensus Forecast for January: 55.5
Range: 53.0 to 56.5
Initial jobless claims fell back sharply in the January 23 week, down 16,000 to 278,000 and helping to make the prior week's six-month high at 294,000 an outlier, at least hopefully an outlier. But continuing claims in this report did not fall back, hitting a 5-month high at 2.268 million and, together with the trend for initial claims, are pointing at less strength for the January employment report. Forecasters see initial claims coming in at 280,000 in the January 30 week.
Initial Jobless Claims - Consensus Forecast for January 30 week: 280,000
Range: 274,000 to 290,000
Pulled down by low output, non-farm productivity is expected to move back into the minus column for the fourth quarter, to a minus 1.8 percent annualized rate. And low productivity makes for high labor costs which are expected to rise at a steep 4.4 percent rate.
Non-Farm Productivity, Adj. Annualized Rate, 1st Estimate - Consensus for Fourth Quarter: -1.8%
Range: -2.6% to -0.5%
Unit Labor Costs, Adj. Annualized Rate, 1st Estimate - Consensus for Fourth Quarter: +4.4%
Range: +1.9% to +5.4%
Pulled down by weak exports and weak demand for energy equipment, the factory sector has been a weak link in the economy. And factory orders are expected to fall sharply in December with the Econoday consensus calling for minus 2.8 percent. This report in November was decidedly weak, reversing strength in October and including important setbacks for capital goods.
Factory Orders, M/M Chg. - Consensus Forecast for December: -2.8%
Range: -3.7% to +0.2%
Nonfarm payrolls are expected to rise 188,00 in January, in what would be a healthy reading that, however, would be far lower than December's outsized 292,000 surge. Jobless claims moved higher in January which points to less strength for the employment report where, however, the unemployment rate is expected to hold at a very healthy 5 percent. Wage readings in this report have been soft but are expected to show life with forecasters calling for a 0.3 percent gain for average hourly earnings that would follow no change in December.
Nonfarm Payrolls - Consensus for January: 188,000
Range: 170,000 to 215,000
Private Payrolls - Consensus for January: 180,000
Range: 160,000 to 206,000
Unemployment Rate - Consensus for January: 5.0%
Range: 4.9% to 5.0%
Average Hourly Earnings - Consensus for January: +0.3%
Range: +0.2% to +0.4%
Average Workweek - Consensus for January: 34.5 hours
Range: 34.4 to 34.5 hours
The nation's trade deficit is expected to widen slightly to $43.0 billion in December from November's $42.4 billion. Weak global demand has been hurting exports while imports, despite strength in the dollar, have also been slipping in what may be a sign of slowing domestic demand. Last week's advanced data on December showed a widening in the goods deficit to $61.5 billion from $60.3 billion.
International Trade Balance - Consensus Forecast for December: -$43.0 billion
Range: -$44.2 to -$41.0 billion
Consumer credit is expected to rise $16.5 billion in December following a $14.0 billion gain in November that included a strong showing for revolving credit and which hinted at greater consumer willingness to take on credit-card debt. Nonrevolving credit, boosted by vehicle sales and also by student loans which are tracked in this report, made a smaller contribution in November, the lowest in nearly four years.
Consumer Credit - Consensus for December: +$16.5 billion
Range: +$11.5 to +$18.3 billion
|
