|
The consumer's alive and there's signs of life in business investment — but there's still no signs of life for inflation. The doves have been working the news wires and unless the August employment report surprises to the upside, there doesn't seem to be much chance of a rate hike at the September 17th FOMC.
 There's no hurry for a rate hike based on the July personal income and outlays report where inflation readings were very quiet. Core PCE prices, the most closely watched inflation indicator of all, rose only 0.1 percent in the month with the year-on-year rate moving downwards, not upwards, to a very quiet plus 1.2 percent. Total prices are also quiet, also at plus 0.1 percent for the monthly rate and at only plus 0.3 percent for the yearly rate. The accompanying graph compares the year-on-year rates of the PCE core, the dark line, with the light line of average hourly earnings. The PCE core has definitely been sagging and is not pointing to any obvious risk of acceleration, especially given the steep declines that have hit commodity prices. In contrast, average hourly earnings have been trending slightly above the 2 percent line but would have to burst substantially higher in Friday's employment report to become a major issue at the September FOMC. There's no hurry for a rate hike based on the July personal income and outlays report where inflation readings were very quiet. Core PCE prices, the most closely watched inflation indicator of all, rose only 0.1 percent in the month with the year-on-year rate moving downwards, not upwards, to a very quiet plus 1.2 percent. Total prices are also quiet, also at plus 0.1 percent for the monthly rate and at only plus 0.3 percent for the yearly rate. The accompanying graph compares the year-on-year rates of the PCE core, the dark line, with the light line of average hourly earnings. The PCE core has definitely been sagging and is not pointing to any obvious risk of acceleration, especially given the steep declines that have hit commodity prices. In contrast, average hourly earnings have been trending slightly above the 2 percent line but would have to burst substantially higher in Friday's employment report to become a major issue at the September FOMC.
 The personal income and outlays report for July was solid throughout with outlays, boosted by vehicle sales, up a respectable 0.3 percent and income, boosted by wages & salaries, up 0.4 percent. Wages & salaries jumped 0.5 percent for the largest gain since November. The gain is welcome and, as seen in the blue columns in the lower right of the graph, ends a long flat spell. But the gain isn't enough to reverse the trend which, seen in the year-on-year rate of the brown line, has been flat so far this year, at 4.2 percent in the three of the last four months and well down from nearly a 6 percent trend late last year. The personal income and outlays report for July was solid throughout with outlays, boosted by vehicle sales, up a respectable 0.3 percent and income, boosted by wages & salaries, up 0.4 percent. Wages & salaries jumped 0.5 percent for the largest gain since November. The gain is welcome and, as seen in the blue columns in the lower right of the graph, ends a long flat spell. But the gain isn't enough to reverse the trend which, seen in the year-on-year rate of the brown line, has been flat so far this year, at 4.2 percent in the three of the last four months and well down from nearly a 6 percent trend late last year.
 Fed policy makers are spending a lot of time talking about the importance of consumer confidence measures where general strength has been pointing to continued gains for household spending. The consumer sentiment index, the dark line in the graph, points to no more than a moderate effect from China's gyrations. The index, which comes out twice a month, came in below expectations, at 91.9 for the final August reading which roughly implies a 91.0 pace over the last two weeks. This is the softest pace since May and the doves can argue that market events in China are hurting consumer confidence. But the hawks can argue that the effect isn't that great. The consumer confidence report, which comes out only once a month and is the light line in the graph, shot higher in August but the cut-off date for the sample was at mid-month which was before the worst of the Chinese mess. Still, there was one very unusual reading in the consumer confidence report and that was a rare 6.5 percentage point drop to 21.9 percent in those describing jobs as currently hard to get. This is an unusually strong signal that points to outsized gains for the August employment report, just what would be needed to revive talk of a September rate hike. Fed policy makers are spending a lot of time talking about the importance of consumer confidence measures where general strength has been pointing to continued gains for household spending. The consumer sentiment index, the dark line in the graph, points to no more than a moderate effect from China's gyrations. The index, which comes out twice a month, came in below expectations, at 91.9 for the final August reading which roughly implies a 91.0 pace over the last two weeks. This is the softest pace since May and the doves can argue that market events in China are hurting consumer confidence. But the hawks can argue that the effect isn't that great. The consumer confidence report, which comes out only once a month and is the light line in the graph, shot higher in August but the cut-off date for the sample was at mid-month which was before the worst of the Chinese mess. Still, there was one very unusual reading in the consumer confidence report and that was a rare 6.5 percentage point drop to 21.9 percent in those describing jobs as currently hard to get. This is an unusually strong signal that points to outsized gains for the August employment report, just what would be needed to revive talk of a September rate hike.
 The big economic news of the week came with the strong upward revision to second-quarter GDP, to annualized 3.7 percent vs 2.3 percent for the initial estimate and compared with the weather-depressed 0.6 percent gain of the first quarter. It's that big swing from the first quarter that had been expected all along, mirroring similar first-quarter to second-quarter swings in 2011 and 2014. Residential investment was very strong, at plus 7.8 percent in the quarter, with improvement in net exports and a build in inventories also helping the revision. Final demand proved very solid, at plus 3.5 percent. GDP points to better-than-expected momentum going into the current quarter where early forecasts are still modest, in the 2-1/2 percent range. The big economic news of the week came with the strong upward revision to second-quarter GDP, to annualized 3.7 percent vs 2.3 percent for the initial estimate and compared with the weather-depressed 0.6 percent gain of the first quarter. It's that big swing from the first quarter that had been expected all along, mirroring similar first-quarter to second-quarter swings in 2011 and 2014. Residential investment was very strong, at plus 7.8 percent in the quarter, with improvement in net exports and a build in inventories also helping the revision. Final demand proved very solid, at plus 3.5 percent. GDP points to better-than-expected momentum going into the current quarter where early forecasts are still modest, in the 2-1/2 percent range.
A highlight of the GDP report is sign of unexpected life in business investment as nonresidential fixed investment, boosted by structures, came in at a respectable 3.2 percent vs an initial reading of minus 0.6 percent. The last couple of columns in the graph, though much lower than prior quarters, do look encouraging. This momentum has extended from the second quarter into the third quarter as core capital goods orders in the durable goods report showed special strength, up 2.2 percent following June's 1.2 percent gain and with related shipments also showing two months of strength. In special good news, the upturn for capital goods likely reflected demand from overseas during July. The government's newest indicator, the advance international trade report, shows a solid 0.7 percent gain for capital goods exports in July for the first gain since March.
 Interesting data, almost conflicting data, came out of the housing sector during the week. New home sales rose solidly in July, up 5.4 percent to a 507,000 annual pace. Year-on-year, sales were up 26 percent in the month. Sales are hot and available homes for sale are scarce which will continue to make building permits one of the economy's bright spots. But, in a reminder that inflation is hard to find, the appreciation in home prices has been very soft, this despite solid sales and low inventories. The year-on-year price of a new home in July did rise to a median $285,900 but the year-on-year rate was only plus 2.0 percent which is a tiny fraction of the gain in sales. Two separate reports during the week on prices of existing home sales also showed weakness. The FHFA house price index came in flat at a year-on-year 5.6 percent with Case-Shiller's 20-city index even more flat, at 5.0 percent. The current lack of house price inflation may not be a central topic at the FOMC but it is consistent with soft pricing in the economy. It's also a reminder that readings on inflation expectations in both the consumer confidence and consumer sentiment reports have been moving lower. Interesting data, almost conflicting data, came out of the housing sector during the week. New home sales rose solidly in July, up 5.4 percent to a 507,000 annual pace. Year-on-year, sales were up 26 percent in the month. Sales are hot and available homes for sale are scarce which will continue to make building permits one of the economy's bright spots. But, in a reminder that inflation is hard to find, the appreciation in home prices has been very soft, this despite solid sales and low inventories. The year-on-year price of a new home in July did rise to a median $285,900 but the year-on-year rate was only plus 2.0 percent which is a tiny fraction of the gain in sales. Two separate reports during the week on prices of existing home sales also showed weakness. The FHFA house price index came in flat at a year-on-year 5.6 percent with Case-Shiller's 20-city index even more flat, at 5.0 percent. The current lack of house price inflation may not be a central topic at the FOMC but it is consistent with soft pricing in the economy. It's also a reminder that readings on inflation expectations in both the consumer confidence and consumer sentiment reports have been moving lower.
 Outside of Janet Yellen, the two most closely followed Federal Reserve policy makers both worked the press this week with Vice Chairman Stanley Fischer trying to straddle the fence but saying "we've got time to wait" and New York Fed President William Dudley saying a September hike is now "less compelling". Their comments focused on the unknown impact of Chinese volatility which, along with employment and inflation, looks to be the third pillar of Federal Reserve policy, at least for the September meeting. Outside of Janet Yellen, the two most closely followed Federal Reserve policy makers both worked the press this week with Vice Chairman Stanley Fischer trying to straddle the fence but saying "we've got time to wait" and New York Fed President William Dudley saying a September hike is now "less compelling". Their comments focused on the unknown impact of Chinese volatility which, along with employment and inflation, looks to be the third pillar of Federal Reserve policy, at least for the September meeting.
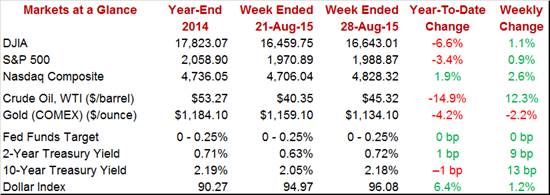
Stocks broke down on Monday but recovered through the week with the Dow up 1.1 percent at 16,643. Money backed out Treasuries where yields rose, including a 9 basis point hike in the 2-year to 0.72 percent. This is a big move for the 2-year which may see more volatility this week tied, not only to China, but also to expectations for the September FOMC. Oil was the week's big gainer, moving from under $40 at mid-week to end near $45.50. The gain is welcome but won't boost August inflation data.
The U.S. economy is solid, proving stronger than expected in the second quarter and looking to get both a consumer-based and perhaps even an export-based lift in the third quarter. But gyrations in China's markets have scrambled the global economic outlook and even have triggered a few calls for more Fed stimulus, not less. With the core PCE index out of the way, next week's August employment report is the last question mark going into the September FOMC. August nonfarm payrolls would have to be strong to give the hawks any chance for a September rate hike, perhaps much stronger than the Econoday consensus for 223,000.
An especially important employment report tops a very busy week that includes motor vehicle sales on Tuesday and the first hard evidence on the consumer for August. Updates on the rebounding factory sector and the ever strong service sector will be posted through mid-week with Wednesday afternoon's Beige Book to offer broad assessments across the economy. Friday's employment report is the last major indicator before the September 17th FOMC meeting. Nonfarm payroll growth is expected to remain moderate at 223,000 while the unemployment rate is expected to tick down 1 tenth to 5.2 percent in results that would be respectable but probably not enough to heat up liftoff talk.
The Chicago PMI is expected to hold little changed, up 2 tenths to a consensus 54.9 that would point to solid monthly growth in the Chicago-area economy. This index had been below breakeven 50 in four of the prior five months.
Chicago PMI - Consensus Forecast for August: 54.9
Range: 53.0 to 57.5
The Dallas Fed index has been coming out of deeply negative territory, at minus 4.6 in July from minus 7.0 in June and minus 20.8 in May. The Econoday consensus is calling for minus 2.5 in August. This report has been offering some of the most striking evidence of oil-patch trouble.
Dallas Fed General Activity Index - Consensus Forecast for August: -2.5
Range: -8.0 to +0.5
The manufacturing PMI is expected to slow to 53.0 in August from 53.8 in July. This report never picked up the auto-related surge for the factory sector during June and July. Among components, exports have been weak in this report but employment strong.
Manufacturing PMI - Consensus Forecast for August, final: 53.0
Range: 52.7 to 54.0
The ISM manufacturing index is not expected to show much change, at a modest 52.7 vs July's 52.8. This report, like the manufacturing PMI, never picked up the factory sector's auto-related surge during June and July. New orders were strong in July but not exports or employment.
ISM Manufacturing Index - Consensus Forecast for August: 52.8
Range: 51.5 to 54.0
Construction spending is expected to rise a sharp 0.8 percent in August following a very soft 0.1 percent rise in July which was held back by an unexpected decline in single-family homes. Housing starts were up in July which should help spending while non-residential building is expected to bounce back from a June dip.
Construction Spending, M/M Chg. - Consensus Forecast for August: +0.8%
Range: +0.2% to +1.4%
Motor vehicle sales are expected to remain very strong but ease back slightly, to a 17.3 million annual unit rate from 17.6 million in July. Motor vehicles, both sales and production, turned out to be the economy's big highlight of June and July. This will be the first hard data on August's consumer sector and a stronger-than-expected reading could revive talk of a September rate hike.
Total Vehicle Sales, Annual Rate - Consensus Forecast for August: 17.3 million
Range: 16.8 to 17.7 million
North American-Made Vehicle Sales, Annual Rate - Consensus Forecast for August: 13.9 million
Range: 13.7 to 14.1 million
The ADP employment report has not been on target much this year, predicting a flop for what turned out to be a respectable July employment report. Forecasters see ADP's private payroll call at 210,000.
ADP Employment - Consensus Forecast for August: 210,000
Range: 190,000 to 227,000
The second estimate for productivity & costs is expected to show a rise in productivity growth to 2.8 percent from 1.3 percent reflecting the upward revision to second-quarter GDP. Higher productivity points to lower unit labor costs which are expected to fall 1.2 percent.
Nonfarm Productivity, Q/Q Chg. - Consensus Forecast for Second Quarter: +2.8%
Range: +1.6% to +3.3%
Unit Labor Costs, Q/Q Chg. - Consensus Forecast for Second Quarter: -1.2%
Range: -1.4% to +0.4%
Factory orders are expected to rise a very strong 0.9 percent in July on top of June's 1.8 percent surge. Both motor vehicles and commercial aircraft are centers of strength for the sector, with early signs of momentum for capital goods another positive.
Factory Orders - Consensus Forecast for July: +0.9%
Range: -0.4% to +1.3%
International trade is expected to show a narrowing in the nation's trade gap to $42.0 billion from June's $43.8 billion. Advance trade data showed a rise for exports and a fall in imports for the month, a solid mix to open third-quarter GDP.
Trade Balance, Level - Consensus Forecast for July: $-42.0 billion
Range: $-45.0 to $-39.3 billion
Initial jobless claims have been very low this year, pointing to very thin layoff activity. Claims are expected to hold near recent levels, at 273,000 in the August 29 week.
New Claims, Level - Consensus Forecast for August 29 Week: 273,000
Range: 268,000 to 278,000
The services PMI is expected to hold at the flash 55.2 for the final August reading. New orders have been strong in this report and hiring has been described as robust, a reminder that the domestic economy, apart from global troubles, remains solid.
Services PMI - Consensus Forecast for August, Final: 55.2
Range: 55.0 to 55.9
The ISM non-manufacturing index surged strongly in July, up more than 4 points to 60.3 for the strongest reading in 10 years. Forecasters see a give back in August but not much, to 58.5 which would still signal exceptional growth for the great bulk of the nation's economy. This report is standing out right now, pointing to outsized strength ahead.
ISM Non-Manufacturing Index - Consensus Forecast for August: 58.5
Range: 56.5 to 61.5
The employment situation report for August is expected to show an incremental uptick with nonfarm payrolls expected to rise 223,000 vs 215,000 in July. The unemployment rate is expected to tick 1 tenth lower to an ever tighter 5.2 percent while average hourly earnings are expected to remain tame, at plus 0.2 percent. Note that the high-end nonfarm payroll forecast, at 257,000, isn't exceptionally strong and even if hit, might not be enough to raise expectations for a September rate hike.
Nonfarm Payrolls, M/M Chg. - Consensus Forecast for August: 223,000
Range: 173,000 to 257,000
Unemployment Rate - Consensus Forecast for August: 5.2%
Range: 5.2% to 5.3%
Private Payrolls, M/M Chg. - Consensus Forecast for July: 211,000
Range: 175,000 to 254,000
Average Hourly Earnings, M/M Chg. - Consensus Forecast for August: +0.2%
Range: +0.2% to +0.4%
Average Workweek - Consensus Forecast for August: 34.6 hours
Range: 34.5 to 34.6 hours
|
