|
The FOMC is sounding hawkish at the same time that housing and consumer confidence are taking hits and while pressures on labor costs are going down not up. But factory orders for once are on the rise and second-quarter GDP, though nothing for the record books, is good enough to keep the Fed's rate-hike railroad on the tracks. What a week it was for economic news! Let's go!
Sherlock's number, you understand, is unknown except to his close chaps. I immediately called him of course after the FOMC statement but I got Dr. Watson instead who, after a difficult couple of minutes trying to read the statement, concluded that Hieroglyphics are not his specialty after all. Forced by necessity to become my own Sherlock, I kept digging and digging until I found a single mysterious word that was added deep inside the text – the word "some". What could this mystification possibly mean?
It apparently means that the Fed has, in a turn of hawkish semantics, lowered the bar for employment growth. The latest statement reads that the FOMC will raise rates when it sees "some further improvement" in the labor market. In contrast, the prior statement in June wasn't wishy washy at all about employment, saying simply that the FOMC will raise rates when it sees "further improvement". The latter is a reminder of Yellen's dovish opening to her June press conference when she noted that nonfarm payroll growth over the prior three months had averaged only 210,000 which she stressed was well short of the 280,000 average over the second half of last year. But with the new wording, the dovish spin is gone. Now perhaps even 210,000 could qualify as "some" further improvement and certainly maybe June's 223,000 could qualify or even July's report where the Econoday consensus is 212,000.
The new wording fits in with the FOMC's communications effort to gradually prepare everyone for the momentous day when they finally do announce liftoff. But what about the elusiveness of the method? Word for word the statement is almost the same – almost. I like word games as much as anybody but couldn't they have saved everyone the trouble? Just say in a header at the top of the statement: "Please note that the word 'some' has been added to the fourth sentence of the third paragraph. Its inclusion is no accident!"
What's the past? It's the GDP report for the second quarter which, for all you big calendar buffs, closed out on June 30th of course. But there's plenty to learn from the report, namely that consumer spending is still solid enough to offset weakness in business spending. Second-quarter GDP came in on the low side of expectations at only a plus 2.3 percent annualized rate which, though soft by long-term standards, isn't soft at all compared to the last five years of the recovery when GDP has averaged only 2.0 percent. And there's another positive in the report, an upward revision to first-quarter GDP which, despite the winter's highly publicized transitory factors, lifts it out of the contraction camp and into the plus column at 0.6 percent. Yes for that!
 Referring to the graph, the swing from this year's first quarter to the second quarter turned out much less dramatic than many had expected earlier in the year, the result of the upward revision to the first quarter together with the second quarter's modest gain. A look at comparisons with prior first and second quarters shows much greater swings in 2011 and 2014. These winter-to-spring ups and downs have been raising questions about seasonal adjustment problems, but an ongoing probe by the Bureau of Economic Analysis shows no structural issues so far. Referring to the graph, the swing from this year's first quarter to the second quarter turned out much less dramatic than many had expected earlier in the year, the result of the upward revision to the first quarter together with the second quarter's modest gain. A look at comparisons with prior first and second quarters shows much greater swings in 2011 and 2014. These winter-to-spring ups and downs have been raising questions about seasonal adjustment problems, but an ongoing probe by the Bureau of Economic Analysis shows no structural issues so far.
 It was the consumer who boosted the second quarter for the economy, not businesses where investment contracted. Residential investment was very strong in the latest quarter at an annualized plus 6.6 percent while personal consumption, boosted by auto spending, rose 2.9 percent. On the minus side was business spending as nonresidential fixed investment fell 0.6 percent. The graph compares these two components of the GDP report and shows the complete breakdown, beginning in the fourth quarter, of business investment in the dark column, the result of both deep domestic contraction in the energy sector as well as weak exports of capital goods. But all along, personal consumption expenditures in the light column, a far larger component in dollar terms, have held steady and have been the economy's bread and butter. Looking at these two components underscores how much of a consumer economy the United States is with personal consumption making up 69 percent of the nation's $16.3 trillion economy. Though non-residential fixed investment is way back at 13 percent of the economy, it's still a very large component of a very large economy where swings can make or break GDP. It was the consumer who boosted the second quarter for the economy, not businesses where investment contracted. Residential investment was very strong in the latest quarter at an annualized plus 6.6 percent while personal consumption, boosted by auto spending, rose 2.9 percent. On the minus side was business spending as nonresidential fixed investment fell 0.6 percent. The graph compares these two components of the GDP report and shows the complete breakdown, beginning in the fourth quarter, of business investment in the dark column, the result of both deep domestic contraction in the energy sector as well as weak exports of capital goods. But all along, personal consumption expenditures in the light column, a far larger component in dollar terms, have held steady and have been the economy's bread and butter. Looking at these two components underscores how much of a consumer economy the United States is with personal consumption making up 69 percent of the nation's $16.3 trillion economy. Though non-residential fixed investment is way back at 13 percent of the economy, it's still a very large component of a very large economy where swings can make or break GDP.
The downturn in business investment has been pulling down factory data all year but not in June, which may signal that the worst for the hard hit sector is hopefully over. Core capital goods orders, a leading indicator for non-residential fixed investment, rose a very solid 0.9 percent in the month and contributed to a 3.4 percent rebound for total orders, a rebound however that mostly reflects a routine month-to-month swing for aircraft.
 The graph compares orders for core capital goods, which are essentially machinery and the parts and materials to make machinery, with total orders for all durable goods. Core capital goods, the dark line, started their slide last autumn when the plunge in oil prices began to depress demand for oil & gas equipment. The slide deepened out to February before stabilizing with June then showing a welcome uptick. The descent for total orders, the bars in the graph, has been less steep and perhaps, with the help of a rebound for capital goods, may soon turn higher. Note that as the graph shows, at roughly $70 billion in any one month, orders for core capital goods make up nearly 30 percent of total durable orders. The graph compares orders for core capital goods, which are essentially machinery and the parts and materials to make machinery, with total orders for all durable goods. Core capital goods, the dark line, started their slide last autumn when the plunge in oil prices began to depress demand for oil & gas equipment. The slide deepened out to February before stabilizing with June then showing a welcome uptick. The descent for total orders, the bars in the graph, has been less steep and perhaps, with the help of a rebound for capital goods, may soon turn higher. Note that as the graph shows, at roughly $70 billion in any one month, orders for core capital goods make up nearly 30 percent of total durable orders.
 Turning briefly to civilian aircraft, which are not part of the core capital goods group, orders surged 103 percent after falling 46 percent in May. Such swings point to the importance of the ex-transportation reading where aircraft are excluded (motor vehicles unfortunately are also excluded but this is a far less volatile category). The graph compares the two headline readings of the durable goods report, total orders in the light line and ex-transportation orders in the dark line. The dark year-on-year line for ex-transportation is much smoother compared to total orders which spiked outrageously in June last year due to a comparison anomaly with the 2014 Farnborough airshow. But the real story, at least for now, is clearly the same for each, declining trends that are falling deeper into the contraction zone. Turning briefly to civilian aircraft, which are not part of the core capital goods group, orders surged 103 percent after falling 46 percent in May. Such swings point to the importance of the ex-transportation reading where aircraft are excluded (motor vehicles unfortunately are also excluded but this is a far less volatile category). The graph compares the two headline readings of the durable goods report, total orders in the light line and ex-transportation orders in the dark line. The dark year-on-year line for ex-transportation is much smoother compared to total orders which spiked outrageously in June last year due to a comparison anomaly with the 2014 Farnborough airshow. But the real story, at least for now, is clearly the same for each, declining trends that are falling deeper into the contraction zone.
 Another one of the nuances of the July FOMC statement is a subtle upgrade for the housing sector where "additional improvement" was cited. It makes you wonder whether policy makers saw the pending home sales report before writing their statement. Instead of rising strongly as widely expected, pending sales fell back a steep 1.8 percent in June. The dip follows the very steep plunge in new home sales posted last month, making for an unexpected back-to-back blow for the summer housing outlook. The graph compares pending sales of existing homes, which are contract signings in the dark line, with final sales of existing homes which is the gray background. Pending sales had been leading the charge, up five months in a row before June's dip. But the charge softened in May before reversing in June making for a weak looking slope, one that may be pointing to similar weakness ahead for final sales. Levels, nevertheless, are still solid as is the broad trend, evident in the year-on-year rate for pending sales which is still an impressive plus 8.2 percent. But buyers do seem a bit indifferent ahead of the Fed's big liftoff, not rushing to lock in what are still low mortgage rates, roughly 4.0 percent for 30-year loans. Strength in housing may contribute less than expected to the second-half economy. Another one of the nuances of the July FOMC statement is a subtle upgrade for the housing sector where "additional improvement" was cited. It makes you wonder whether policy makers saw the pending home sales report before writing their statement. Instead of rising strongly as widely expected, pending sales fell back a steep 1.8 percent in June. The dip follows the very steep plunge in new home sales posted last month, making for an unexpected back-to-back blow for the summer housing outlook. The graph compares pending sales of existing homes, which are contract signings in the dark line, with final sales of existing homes which is the gray background. Pending sales had been leading the charge, up five months in a row before June's dip. But the charge softened in May before reversing in June making for a weak looking slope, one that may be pointing to similar weakness ahead for final sales. Levels, nevertheless, are still solid as is the broad trend, evident in the year-on-year rate for pending sales which is still an impressive plus 8.2 percent. But buyers do seem a bit indifferent ahead of the Fed's big liftoff, not rushing to lock in what are still low mortgage rates, roughly 4.0 percent for 30-year loans. Strength in housing may contribute less than expected to the second-half economy.
 The Fed has some explaining to do as readings on consumer confidence, which had been supporting its outlook for improvement in household spending, are now moving down from recovery highs. The consumer confidence index fell substantially in July, down more than 10 points to 90.9 for the lowest reading since September. Weakness is centered in the expectations component which fell nearly 13 points reflecting sudden pessimism in the jobs outlook where an unusually large percentage, at 20.0 percent, see fewer jobs opening up over the next six months. A striking negative in the report is a big drop in buying plans for autos, hinting at summer slowing for vehicle sales which positively surged in the spring. The declines are mirrored, though less severely, in the consumer sentiment index which fell 3.0 points in July to 93.1. Here too, weakness is centered in the expectations component underscoring a lack of optimism over the jobs outlook. Both reports also show slowing for current conditions readings, hinting at a downtick for month-to-month consumer spending. What's behind July's blue mood? Perhaps all the troubles in Greece or the volatility in China's markets, but U.S. consumers are typically insulated from international events. More directly, the downtick is a likely signal that jobs and wages aren't that hot. The Fed has some explaining to do as readings on consumer confidence, which had been supporting its outlook for improvement in household spending, are now moving down from recovery highs. The consumer confidence index fell substantially in July, down more than 10 points to 90.9 for the lowest reading since September. Weakness is centered in the expectations component which fell nearly 13 points reflecting sudden pessimism in the jobs outlook where an unusually large percentage, at 20.0 percent, see fewer jobs opening up over the next six months. A striking negative in the report is a big drop in buying plans for autos, hinting at summer slowing for vehicle sales which positively surged in the spring. The declines are mirrored, though less severely, in the consumer sentiment index which fell 3.0 points in July to 93.1. Here too, weakness is centered in the expectations component underscoring a lack of optimism over the jobs outlook. Both reports also show slowing for current conditions readings, hinting at a downtick for month-to-month consumer spending. What's behind July's blue mood? Perhaps all the troubles in Greece or the volatility in China's markets, but U.S. consumers are typically insulated from international events. More directly, the downtick is a likely signal that jobs and wages aren't that hot.
 In the week's truly shocking result, the employment cost index rose only 0.2 percent in the second quarter which was far below expectations and the lowest result in the 33-year history of the report. Year-on-year, the ECI fell 6 tenths to plus 2.0 percent which is among the lowest readings on record. The record low is plus 1.4 percent back in the early recovery days of 2009 when, apparently unlike today, there was enormous slack in the labor market. The ECI's two components both fell back sharply with wages & salaries moving down to plus 0.2 percent from 0.7 percent in the first quarter and benefits to plus 0.1 percent vs the first quarter's plus 0.6 percent. Year-on-year, wages & salaries are up 2.1 percent with benefits, despite Obamacare, below the 2 percent threshold at 1.8 percent. The data are a reminder of the big decline in average hourly earnings during June, which fell 3 tenths from May to 2 percent even. In the week's truly shocking result, the employment cost index rose only 0.2 percent in the second quarter which was far below expectations and the lowest result in the 33-year history of the report. Year-on-year, the ECI fell 6 tenths to plus 2.0 percent which is among the lowest readings on record. The record low is plus 1.4 percent back in the early recovery days of 2009 when, apparently unlike today, there was enormous slack in the labor market. The ECI's two components both fell back sharply with wages & salaries moving down to plus 0.2 percent from 0.7 percent in the first quarter and benefits to plus 0.1 percent vs the first quarter's plus 0.6 percent. Year-on-year, wages & salaries are up 2.1 percent with benefits, despite Obamacare, below the 2 percent threshold at 1.8 percent. The data are a reminder of the big decline in average hourly earnings during June, which fell 3 tenths from May to 2 percent even.
 The easing in labor costs runs completely counter to expectations, that low levels of unemployment should be pushing up labor costs. Initial jobless claims, as seen in the graph, have been coming way down, in fact hit a 42-year low in the July 18 week. The unemployment rate, remember, is at a recovery low of 5.3 percent on its inexorable march to the 5.0 percent line. The lack of traction in employment costs is certain to bring out a flurry of comments and explanations from policy makers who have been counting on wage pressures to offset continuing weakness in commodity prices. Based on the ECI, the Fed's 2 percent goal for core inflation is looking elusive. The easing in labor costs runs completely counter to expectations, that low levels of unemployment should be pushing up labor costs. Initial jobless claims, as seen in the graph, have been coming way down, in fact hit a 42-year low in the July 18 week. The unemployment rate, remember, is at a recovery low of 5.3 percent on its inexorable march to the 5.0 percent line. The lack of traction in employment costs is certain to bring out a flurry of comments and explanations from policy makers who have been counting on wage pressures to offset continuing weakness in commodity prices. Based on the ECI, the Fed's 2 percent goal for core inflation is looking elusive.
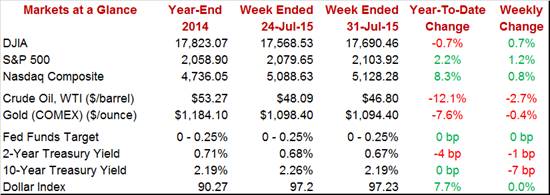
 The week opened with another huge plunge in the Shanghai composite, this time 8.5 percent, before a run of steady sessions out of China helped boost demand for risk. After falling more than 2 percent in the prior week, U.S. indexes rose roughly 1 percent led by a 1.2 percent gain for the S&P 500 to 2,103 and including a 0.7 percent rise for the Dow to 17,690. Soft U.S. economic news during the week, news that isn't pulling forward liftoff expectations, was probably also a positive for the stock market which, however, didn't respond to the shockingly low reading for the employment cost index. Instead, Friday's session was dominated by weakness in energy shares in line with a new plunge in oil which is now below $47 for a 12.1 percent year-to-date decline. The bond market, however, did respond to the ECI with the 10-year yield, after a steady week, falling 7 basis points on Friday to end the week where it started the year, at 2.19 percent. The week opened with another huge plunge in the Shanghai composite, this time 8.5 percent, before a run of steady sessions out of China helped boost demand for risk. After falling more than 2 percent in the prior week, U.S. indexes rose roughly 1 percent led by a 1.2 percent gain for the S&P 500 to 2,103 and including a 0.7 percent rise for the Dow to 17,690. Soft U.S. economic news during the week, news that isn't pulling forward liftoff expectations, was probably also a positive for the stock market which, however, didn't respond to the shockingly low reading for the employment cost index. Instead, Friday's session was dominated by weakness in energy shares in line with a new plunge in oil which is now below $47 for a 12.1 percent year-to-date decline. The bond market, however, did respond to the ECI with the 10-year yield, after a steady week, falling 7 basis points on Friday to end the week where it started the year, at 2.19 percent.
The economy may be just puttering along but that's been the recovery's story all along. There's still plenty of data to go especially with Friday's employment report, so whether the hike comes at the September FOMC or the December FOMC is still anyone's guess (forget about the dotless October FOMC which, if they wanted to lift off, would require the unsettling spectacle of an unscheduled press conference).
This is a blockbuster week for economic data that gets started with a very busy Monday. Personal income and outlays are expected to prove soft along with the PCE core index, a key price index for the FOMC and where lack of pressure has not been signaling any urgency for a rate hike. Two national reports out of the struggling manufacturing sector will also be released Monday along with construction spending which, boosted by strength in residential permits, is expected to post a solid rise. International trade data and the latest on exports, which have been weak, will head Wednesday's calendar that will also include two national reports on the economy's most resilient sector, services. Thursday will see jobless claims ahead of Friday's employment report where intrend growth, at an Econoday consensus of 212,000 for non-farm payroll, is expected to extend to July.
Personal income and outlays are expected to ease substantially from outsized gains in May with income forecast to rise 0.3 percent, down from May's 0.5 percent, and spending to inch 0.2 percent higher following May's auto-related spike of 0.9 percent. But the major headline to come out of the report will be the PCE core price index which, not pointing to any urgency for a rate hike, is expected to remain very subdued for a third month at only plus 0.1 percent. If the report comes in as expected, the odds could fall for a September rate hike.
Personal Income - Consensus Forecast for June: +0.3%
Range: +0.0% to +0.4%
Personal Outlays - Consensus Forecast for June: +0.2%
Range: +0.0% to +0.4%
PCE Price Index - Consensus Forecast for June: +0.2%
Range: +0.2% to +0.3%
PCE Core Price Index - Consensus Forecast for June: +0.1%
Range: +0.1% to +0.2%
Growth in the manufacturing PMI has been cooling this year, held down by reduced capital spending in the energy sector and general weakness in exports. Still this report, trending just under 55, has been consistently over-estimating growth in the manufacturing sector which has in fact been edging into the negative column over the last year.
Manufacturing PMI, Final - Consensus Forecast for July: 53.8
Range: 53.5 to 54.0
The ISM manufacturing index is expected to hold steady, at 53.7 in July vs 53.5 in June. This report has been trending in the low 50s, signaling only marginal growth for a sector that has actually been in slight contraction. New export orders are an important reading in this report, coming in under 50 in four of the last six reports in an accurate signal of export contraction.
ISM Manufacturing Index - Consensus Forecast for July: 53.7
Range: 53.0 to 54.5
Construction spending is expected to rise 0.6 percent in June, getting a boost from the residential component where starts and permits have been surging. A headline gain would follow May's 0.8 percent rise and would boost the outlook for both construction and for new home sales which fell back suddenly and dramatically at the outset of summer.
Construction Spending - Consensus Forecast for June: +0.6%
Range: +0.3% to +1.6%
Motor vehicle sales have been one of the most important indicators so far this year, falling at the start of the year before coming on strongly in the spring including a great spike in May to 17.8 million units. May proved too hard of a comparison for June but forecasters see July coming in at June's very respectable rate of 17.2 million.
Motor Vehicle Sales, Total - Consensus Forecast for July: 17.2 million
Range: 17.0 to 17.5 million
Motor Vehicle Sales, Domestic - Consensus Forecast for July: 13.6 million
Range: 13.3 to 13.7 million
Boosted by the prior release of an aircraft-driven 3.4 percent gain in the durables component, factory orders are expected to rise 1.7 percent in June. This would be only the second gain over the last full year for factory orders which have been pulled down by falling demand for oil & gas equipment and generally weak export markets. Aircraft orders have been playing unusual havoc with the data in recent months which puts special emphasis on the ex-transportation reading.
Factory Orders - Consensus Forecast for June: +1.7%
Range: +0.7% to +2.5%
The ADP employment report is expected to show a 210,000 gain for private payrolls in July vs ADP's 237,000 estimate for June which proved to be on the high side. This report, though ambitious in scope, has had a checkered track record and, unless wildly outside expectations, isn't likely to move the markets.
ADP Employment Report - Consensus Forecast for July: 210,000
Range: 190,000 to 260,000
The international trade report is expected to show a widening of the nation's trade gap to $43.0 billion from May's $41.9 billion. The strength of the dollar is at play in this report, boosting imports and depressing exports with the latter a major issue right now for the factory sector. In a special positive, watch for continuing declines in the petroleum gap which, due to rising domestic oil production and rising exports of fuels, is at a 13-year low.
International Trade: -$43.0 billion
Range: -$44.4 to -$40.5 billion
The services PMI is expected to end July at a very healthy 55.2. The flash report cited strength in new orders from both the consumer side and the business side with the latter offering one of the few hints of strength for business investment. A negative, however, was softness in the 12-month outlook in a reading that has since been confirmed on the consumer side with declines in the expectations components of both the consumer confidence and consumer sentiment reports.
Services PMI, final - Consensus Forecast for July: 55.2
Range: 55.0 to 55.2
The ISM non-manufacturing index is expected to hold steady, at 56.2 for July vs a very solid 56.0 in June. This index has held solidly over 55 for the last year, underscoring the strength of the domestic economy which, offsetting the headwind from exports, has kept up GDP. The report's employment index, which slowed noticeably in June, always gets special attention ahead of the employment report.
ISM Non-Manufacturing Index - Consensus Forecast for July: 56.2
Range: 55.0 to 57.5
Jobless claims have been unusually low since March, offering highly favorable indications on the unemployment side of the labor market. Note that the prior week for this report, where the sample week was the same as the monthly employment report, points to strength for tomorrow's data on July.
Jobless Claims - Consensus Forecast for August 1 week: 273,000
Range: 250,000 to 275,000
The employment situation report has not been strong but has been strong enough to keep up expectations for a rate hike later this year. The Econoday consensus for July non-farm payroll growth is 212,000 vs 223,000 in June and compared against the second-quarter average of 221,000. The unemployment rate, which ratcheted 2 tenths lower in June on a striking decline in the labor force, is expected to hold steady at 5.3 percent. Average hourly earnings, which came to a sudden standstill in June, are expected to rebound a moderate 0.2 percent and will be watched with extra attention for inflation clues on Fed policy.
Non-farm Payrolls - Consensus Forecast for July: 212,000
Range: 210,000 to 262,000
Unemployment Rate - Consensus Forecast for July: 5.3%
Range: 5.2% to 5.4%
Private Payrolls - Consensus Forecast for July: 210,000
Range: 200,000 to 258,000
Average Hourly Earnings - Consensus Forecast for July: +0.2%
Range: +0.2% to +0.3%
Average Workweek - Consensus Forecast for July: 34.5 hours
Range: 34.5 to 34.6 hours
Revolving credit has been on the climb in the consumer credit report, offering a possible signal of deepening strength for consumer spending. Still, this report is dominated by the non-revolving component where the inclusion of student loans has been exaggerating gains.
Consumer Credit - Consensus Forecast for June: +$17.4 billion
Range: +$14.0 to +$19.5 billion
|
