|
This past week the Fed FOMC statement changed guidance on rates by eliminating "patient" on future potential changes but overall the FOMC clearly was dovish. Economic news was not inspiring.
 This past week, the dovish Fed FOMC statement lifted equities. The week started with anticipation that the Fed would stay loose due to recently soft economic data, lifting equities Monday. However, a still strong dollar weighed on stocks on worries about repatriated profits from earnings abroad for U.S. companies. A stronger dollar lowers repatriated profits. After little change Tuesday, equities gained Wednesday on a very dovish FOMC statement even though technically "patient" was removed from guidance. This past week, the dovish Fed FOMC statement lifted equities. The week started with anticipation that the Fed would stay loose due to recently soft economic data, lifting equities Monday. However, a still strong dollar weighed on stocks on worries about repatriated profits from earnings abroad for U.S. companies. A stronger dollar lowers repatriated profits. After little change Tuesday, equities gained Wednesday on a very dovish FOMC statement even though technically "patient" was removed from guidance.
 Thursday was mixed with some indexes coming off Fed related euphoria. Friday, sentiment changed, focusing on both Fed policy and central bank policy overseas. Equities gained on belief that the Fed will not change its near zero policy until at least mid-year and likely later. Traders also noted that monetary policy in Europe will be easing. Thursday was mixed with some indexes coming off Fed related euphoria. Friday, sentiment changed, focusing on both Fed policy and central bank policy overseas. Equities gained on belief that the Fed will not change its near zero policy until at least mid-year and likely later. Traders also noted that monetary policy in Europe will be easing.
Equities were up this past week. The Dow was up 2.1 percent; the S&P 500, up 2.7 percent; the Nasdaq, up 3.2 percent; the Russell 2000, up 2.8 percent; and the Wilshire 5000, up 2.7 percent.
For the year-to-date, major indexes are up as follows: the Dow, up 1.7 percent; the S&P 500, up 2.4 percent; the Nasdaq, up 6.1 percent; the Russell 2000, up 5.1 percent; and the Wilshire 5000, up 3.1 percent.
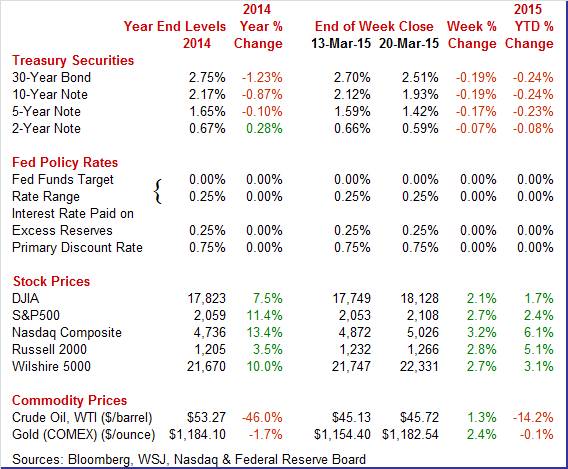
Weekly percent change column reflects percent changes for all components except interest rates. Interest rate changes are reflected in simple differences.
 Treasury yields ended the week notably lower—largely due to the Fed. Rates eased Monday on general economic conditions. Traders worried that U.S. and European growth was slowing but at the dollar was gaining strength. After little change Tuesday, yields dropped sharply Wednesday on a very dovish Fed FOMC statement. Yields gained moderately Thursday simply on some pullback from Wednesday. Friday was little changed. Overall, loose Fed policy weighs on Treasury yields with European monetary policy contributing. Treasury yields ended the week notably lower—largely due to the Fed. Rates eased Monday on general economic conditions. Traders worried that U.S. and European growth was slowing but at the dollar was gaining strength. After little change Tuesday, yields dropped sharply Wednesday on a very dovish Fed FOMC statement. Yields gained moderately Thursday simply on some pullback from Wednesday. Friday was little changed. Overall, loose Fed policy weighs on Treasury yields with European monetary policy contributing.
For this past week Treasury rates were down as follows: 3-month T-bill, down 2 basis points; the 2-year note, down 7 basis points; the 5-year note, down 17 basis points; the 7-year note, down 19 basis points; the 10-year note, down 19basis points; and the 30-year bond, down 19 basis points.
 Crude oil was essentially unchanged for the week but there were some notable daily swings. Crude oil was essentially unchanged for the week but there were some notable daily swings.
Spot West Texas Intermediate declined somewhat over $2 per barrel Monday on news that stockpiles had increased at Cushing, Oklahoma. Spot crude rebounded below $2 per barrel Tuesday after Monday's jump. Futures, however, declined. Markets have increased uncertainty about the direction of oil prices.
After little change Wednesday and Thursday, spot WTI gained somewhat under $2 per barrel on news of reduced rig counts and new rules from the Obama administration slowing fracturing.
Net for the week, the spot price for West Texas Intermediate moved up a marginal 59 cents per barrel to $45.72.
Overall, the economy appears to be posting slower growth. But the Fed is remaining patient about rate hikes even though that phrase is no longer in Fed guidance.
 In this past week's FOMC statement, the Fed eliminated the word "patient" regarding when rates begin to rise. There was no change in policy rates. But the Fed changed its characterization of the economy. Growth is no longer "solid" as noted in January but "economic growth has moderated somewhat." The statement is somewhat dovish. In this past week's FOMC statement, the Fed eliminated the word "patient" regarding when rates begin to rise. There was no change in policy rates. But the Fed changed its characterization of the economy. Growth is no longer "solid" as noted in January but "economic growth has moderated somewhat." The statement is somewhat dovish.
The Fed was a little positive about the labor market.
"A range of labor market indicators suggests that underutilization of labor resources continues to diminish."
The Fed lowered its forecasts for the unemployment rate but also for GDP growth and inflation. The Fed appears to either be willing to accept lower unemployment or acknowledge that labor force participation is declining. The lower GDP and inflation number support the Fed's dovish statement today.
The emphasis has to be data dependency. Recent indicators have softened as noted in the statement.
Yes, the unemployment rate has declined to 5.5 percent-ammunition for the hawks at the Fed.
But wages are still soft-for production workers wages are up only 1.6 percent on a year-on-year basis.
PCE inflation on a year-ago basis is up only 0.2 percent. Core PCE inflation on a year-ago basis is up only 1.3 percent.
Recent economic news has not been favorable.
The manufacturing sector continues to struggle. Industrial production for February edged up 0.1 percent after declining 0.3 percent in January. Overall industrial production was supported by a spike in utilities-other major components declined. Manufacturing dipped 0.2 percent in February after falling 0.3 percent the month before. This was the third consecutive decline for this component. Housing starts unexpectedly fell sharply in February. Starts fell a monthly 17.0 percent, following no change in January. This was the lowest starts level since January 2014 with a 0.897 million unit annualized pace. Retail sales dropped in February but gasoline prices are not to blame-rather auto sales. Retail sales in February declined 0.6 percent after decreasing 0.8 percent in January.
Overall, the Fed is not in a hurry to raise policy rates. The economy appears to need more monetary policy support than viewed in January. The next rate increase appears to now be late this year or even early next year. However, the Fed chair did not rule out a rate increase after April if data suggest.
 The latest industrial production report was marginally positive but the details showed notable weakness. The latest industrial production report was marginally positive but the details showed notable weakness.
The manufacturing sector continues to struggle. Industrial production for February edged up 0.1 percent after declining 0.3 percent in January. Overall industrial production was supported by a spike in utilities-other major components declined.
Manufacturing dipped 0.2 percent in February after falling 0.3 percent the month before. This was the third consecutive decline for this component. The manufacturing drop was worse than analysts' forecast for a 0.1 percent rise. Notably, manufacturing was revised down for January from plus 0.2 percent to minus 0.3 percent.
Mining dropped 2.5 percent in February after a 1.3 percent decrease the prior month. Utilities surged 7.3 percent after gaining 1.0 percent in January.
Overall capacity utilization slipped to 78.9 percent from 79.1 percent in January.
The detail of the industrial production report helped to support the Fed's FOMC decision to keep guidance loose.
 General conditions so far in March, at an index of 6.90, remain modestly favorable in the New York State manufacturing sector but order data have been very soft both this quarter and going back to the fourth quarter. New orders are in contraction in the March report, at minus 2.39 which is the second negative reading of the last 6 months, a stretch where this reading has averaged a pitiful plus 2.24. Backlog orders, which are always weak in this report, have been in severe contraction, at minus 13.40 in the March report for a 6-month average of minus 10.75. General conditions so far in March, at an index of 6.90, remain modestly favorable in the New York State manufacturing sector but order data have been very soft both this quarter and going back to the fourth quarter. New orders are in contraction in the March report, at minus 2.39 which is the second negative reading of the last 6 months, a stretch where this reading has averaged a pitiful plus 2.24. Backlog orders, which are always weak in this report, have been in severe contraction, at minus 13.40 in the March report for a 6-month average of minus 10.75.
 Slow growth with weakness in orders is the common thread for both the Empire State report, released earlier this week, and now the Philly Fed where the general conditions index held little changed at 5.0 in March versus 5.2 in February. New orders, at 3.9, are not much above zero while unfilled orders are suddenly well below zero, at minus 13.8 in a sharp decline from February's plus 7.3. Slow growth with weakness in orders is the common thread for both the Empire State report, released earlier this week, and now the Philly Fed where the general conditions index held little changed at 5.0 in March versus 5.2 in February. New orders, at 3.9, are not much above zero while unfilled orders are suddenly well below zero, at minus 13.8 in a sharp decline from February's plus 7.3.
Weakness in orders points to softness in shipments, which are already below zero at minus 7.8, as well as softness in employment which is struggling to stay above zero at 3.5. Price data show contraction for both inputs, at minus 3.0, and finished goods, at minus 6.4.
The early indications on March are not that positive in what would extend a series of weak months for the manufacturing sector, a sector that the FOMC noted is being hurt by weak exports tied to weak foreign demand and weighed down somewhat by the strong dollar.
Again, regional manufacturing data support the Fed's decision for loose monetary policy.
 Weather appears to be messing with housing data. Current activity is down sharply but planned activity is level, although still soft. Weather appears to be messing with housing data. Current activity is down sharply but planned activity is level, although still soft.
Housing starts unexpectedly fell sharply in February. Starts fell a monthly 17.0 percent, following no change in January. The 0.897 million unit pace was down 3.3 percent on a year-ago basis. This was the lowest starts level since January 2014 with a 0.897 million unit annualized pace.
Single-family units dipped 14.9 percent in February, following a 3.9 percent decrease the month before. Multifamily units dropped 20.8 percent after rising 7.9 percent in January.
 By region, the Northeast Census region fell a whopping 56.6 percent (likely weather related). Declines were also seen in other regions: the Midwest down 37.0 percent; the West down 18.2 percent; and the South down 2.5 percent. By region, the Northeast Census region fell a whopping 56.6 percent (likely weather related). Declines were also seen in other regions: the Midwest down 37.0 percent; the West down 18.2 percent; and the South down 2.5 percent.
Housing permits, however, were more positive, gaining 3.0 percent after no change in January. The 1.092 million unit pace was up 7.7 percent on a year-ago basis.
The housing sector is hard to read due to severe winter weather. The outlook is not as bad as current activity. But this sector is still sluggish looking forward.
 Growth in the index of leading economic indicators held steady at 0.2 percent in February, pointing to moderate growth for the economy over the next 6 months. Once again the yield spread is the biggest positive for the index reflecting the Fed's near zero rate policy. The stock market is the next biggest positive followed by the report's credit index, an index that has however consistently been pointing to healthier borrowing conditions than government reports. Consumer expectations are also a positive in February but are very likely to reverse in March given the mid-month plunge in the consumer sentiment index. Growth in the index of leading economic indicators held steady at 0.2 percent in February, pointing to moderate growth for the economy over the next 6 months. Once again the yield spread is the biggest positive for the index reflecting the Fed's near zero rate policy. The stock market is the next biggest positive followed by the report's credit index, an index that has however consistently been pointing to healthier borrowing conditions than government reports. Consumer expectations are also a positive in February but are very likely to reverse in March given the mid-month plunge in the consumer sentiment index.
Other readings include a 0.2 percent rise in the coincident index, which points to moderate ongoing growth, and a 0.3 percent rise in the lagging index, which points to moderate past growth. Growth may be slow but it is sustainable.
The latest report suggests continued moderate growth but likely below historical growth for post-recession. This is one more indicator to suggest to the Fed to go slow on rate hikes.
Recent economic news has been soft on average and the Fed noticed. The latest FOMC statement is technically hawkish with the removal of "patient" in guidance but the overall tone of the statement is very dovish. Count on the Fed to remain policy loose although very (emphasis on "very") marginal tightening steps could occur late this year.
The wavering sectors of the economy recently have been housing and manufacturing. Adverse weather has made the latest numbers hard to read but we may be getting out of that issue. For housing, sales have been soft seasonally adjusted over the winter. We get somewhat normalized numbers for existing and new home sales. With a stronger dollar and weaker growth in Europe and Asia, manufacturing has slowed, depending on domestic demand. Durables orders will point to whether the manufacturing sector returns positive after three monthly declines in manufacturing output ending in February.
The Chicago Fed National Activity Index for January jumped back into the plus column, to 0.13 from December's revised minus 0.7. The 3-month average is very strong, little changed at plus 0.33. The big swing factor for January was production-related indicators which rose to plus 0.02 from December's minus 0.22 in a gain driven by a swing higher for industrial production. The negative reading from consumption & housing improved to minus 0.10 from minus 0.13 while the contribution from sales/orders/inventories held unchanged at plus 0.03. Employment remains a big plus but, due to a tick higher for the unemployment rate to 5.7 percent, a little less so, at plus 0.18 from plus 0.28.
Chicago Fed National Activity Index Consensus Forecast for February 15: 0.15
Range: 0.10 to 0.20
Existing home sales in January fell a very steep 4.9 percent to an annual rate of 4.82 million which is the lowest rate since April last year. All regions showed single-digit declines with the West the deepest, at minus 7.1 percent. Declines hit both single-family homes, at minus 5.1 percent, and condos, at minus 3.5 percent. Price concessions didn't help the month's sales with the median down 4.1 percent to $199,600. This is the first reading below $200,000 since March last year. The drop in sales made for a sizable rise in inventory relative to sales, to 4.7 months vs December's 4.4 months.
Existing home sales Consensus Forecast for February 15: 4.940 million-unit rate
Range: 4.650 to 5.050 million-unit rate
The consumer price index fell a sharp 0.7 percent in January after declining 0.3 percent in December. Energy plunged 9.7 percent after dropping 4.7 percent in December. Gasoline plummeted 18.7 percent, following a 9.2 percent fall in December. Food posted at unchanged, following a rise of 0.2 percent in the previous month. Excluding food and energy, consumer price inflation firmed to a 0.2 percent after a modest 0.1 percent rise December. The shelter index rose 0.3 percent, and the indexes for personal care, for apparel, and for recreation increased as well. The medical care index was unchanged, while an array of indexes declined in January, including those for household furnishings and operations, alcoholic beverages, new vehicles, used cars and trucks, airline fares, and tobacco.
CPI Consensus Forecast for February 15 +0.2 percent
Range: +0.1 to +0.7 percent
CPI ex food & energy Consensus Forecast for February 15: +0.1 percent
Range: 0.0 to +0.2 percent
The FHFA purchase only house price index gained 0.8 percent in December, following a 0.7 percent boost in November. Market expectations were for a 0.5 percent gain in December. The year-ago rate posted at 5.4 percent from 5.2 percent in November. Housing appreciation is the one facet of housing that in recent months has been consistently on an uptrend.
This report along with the Case-Shiller report trended higher going into year-end, perhaps offering some explanation for the January spike in consumer confidence. It is important to remember that price data in the existing home sales and new home sales reports, which unlike Case-Shiller and
FHFA purchase only house price index Consensus Forecast for January 15: +0.5 percent
Range: +0.3 to +1.7 percent
The Markit PMI manufacturing index (final) in February rose to a final 55.1 from 54.3 at mid-month and 53.9 in final January. The 0.8 point gain from mid-month implies a roughly 56.0 level for the last two weeks of February. Strength in Markit's sample group was centered in output and new orders, both of which were rising at 4-month highs. Shipping delays, typically indicative of tie-ups tied to strong demand, were also a positive factor for the index, but in this case the delays were tied to snags not related to demand, that is the West Coast port slowdown and heavy weather on the East Coast.
Markit PMI manufacturing flash index Consensus Forecast for March 15: 54.7
Range: 53.7 to 56.0
New home sales were little changed in January at a better-than-expected 481,000 annual pace and edging down only 0.2 percent, managed to hold onto December's big surge when sales jumped 8.1 percent to 482,000. January's strength was centered in what is by far the largest region, the South, where sales rose 2.2 percent. Sales slipped 0.8 percent in the West which was second, and a very distant second, in size to the South. Inventory has been on the thin side for the last 5 years but, at 218,000 units now on the market, was the highest since March 2010. But relative to sales, inventory still looks thin at 5.4 months which should encourage builders to step up activity.
New home sales Consensus Forecast for February 14: 462 thousand-unit annual rate
Range: 433 thousand to 485 thousand-unit annual rate
The Richmond Fed manufacturing index in February essentially was flat where the index was at zero from 6 in January. A zero reading indicates no monthly change in the rate of activity. Details are mostly weak including slight declines for new orders and shipments and a steep decline in backlogs. Positives are led by respectable growth in hiring and for wages. Prices readings are low and show continued easing. This report ties in with other early indications of flatness in this month's manufacturing sector.
Richmond Fed manufacturing index Consensus Forecast for March 15: 2
Range: -4 to 5
Durable goods orders rebounded 2.8 percent in January after dropping 3.7 percent in December and falling 2.2 percent in November. Excluding transportation, the core was flat after slipping 0.8 percent in December. Transportation rebounded 9.7 percent, following a monthly plunge of 10.0 percent the prior month. Motor vehicles were unchanged, nondefense aircraft surged a monthly 128.7 percent, defense aircraft decreased 6.5 percent, and ships & boats decreased 31.4 percent. Outside of the core, orders were mixed. Industries that advanced were machinery, computers & electronics, and "other." Declines were seen in primary metals and electrical equipment.
Numbers reflect revisions from the more recent total factory orders report.
New orders for durable goods Consensus Forecast for February 15: +0.7 percent
Range: -2.0 percent to +2.0 percent
New orders for durable goods, ex-trans., Consensus Forecast for February 15: +0.3 percent
Range: -0.8 percent to +0.8 percent
Initial jobless claims inched 1,000 higher in the March 14 week to 291,000 with the 4-week average up a modest 2,250 to 304,750. The latest week's data are of special importance given that the week is also the sample week for the March employment report. Comparisons with the sample week in February show a 9,000 rise (291,000 vs 282,000) but a steeper 21,750 rise for the 4-week average (304,750 vs 283,000).
Jobless Claims Consensus Forecast for 3/21/15: 293,000
Range: 282,000 to 300,000
The Markit PMI services index picked up noticeably in February to a 4-month high of 57.1 versus 54.2 in January. The final reading for February was little changed from the flash estimate of 57.0. Both new business and output were at 4-month highs, reflecting what the report says are stronger customer demand and improving economic conditions.
Markit PMI services index (flash) Consensus Forecast for March 15: 57.0
Range: 56.2 to 57.3
The Kansas City Fed manufacturing index posted at 1 in February, down from 3 in January and 8 in December. The overall slower growth was mostly attributable to large declines in primary metals and computer and electronics production. Looking across District states, the weakest activity was in Colorado, Oklahoma, and New Mexico. In contrast, production activity in the fabricated metals and machinery industries both increased moderately. Other month-over-month indexes were mixed. The production and shipments indexes both moved back into positive territory. In contrast, the new orders index continued to decline, and the employment index decreased from 0 to minus 4. The finished goods inventory index eased from 8 to 3, and the raw materials inventory index also fell.
Kansas City Fed manufacturing index Consensus Forecast for March 15: 0
Range: -2 to 1
GDP fourth quarter GDP growth was revised down but the good news is that the softer growth was mainly due to a lower estimate for inventory investment. The economy grew 2.2 percent in the fourth quarter compared to the advance estimate of 2.6 percent. Expectations were for 2.1 percent. Final sales of domestic product were revised up to 2.1 percent from the initial estimate of 1.8 percent. Final sales to domestic purchasers were revised up to 3.2 percent from 2.8 percent. With the second estimate for the fourth quarter, inventory growth was revised down to $88.4 billion from the advance estimate of $113.1 billion. On the price front, the chain-weighted price index was revised up marginally to 0.1 percent annualized, compared to the advance estimate of no change. The core chain index, excluding food and energy, was unrevised from the initial estimate of 0.7 percent.
Real GDP Consensus Forecast for third estimate Q4 14: +2.4 percent annual rate
Range: +2.1 to +2.6 percent annual rate
GDP price index Consensus Forecast for third estimate Q4 14: +0.1 percent annual rate
Range: +0.1 to +0.1 percent annual rate
The University of Michigan's consumer sentiment index for the first read on March fell very sharply to 91.2, down 4.2 points from final February for the lowest reading since November. Sentiment peaked at 98.2 in mid-month January which was the highest reading in 8 years. The two components of the headline index both show weakness, at 103.0 for a 3.9 point decline for current conditions and at 83.7 for a 4.3 point decline for expectations. The decline in current conditions points to weakness for consumer spending this month relative to February while the decline in expectations points to a falling off in confidence for the jobs outlook.
Consumer sentiment Consensus Forecast for final March 15: 92.1
Range: 91.0 to 95.0
R. Mark Rogers can be found on a weekly broadcast talking about the U.S. economy, the easiest way to find him is by going to iTunes and searching for "Simply Economics."
Econoday Senior Writer Mark Pender contributed to this article.
|
