|
The consumer sector seems to be holding its own. However, the construction and manufacturing sectors are question marks.
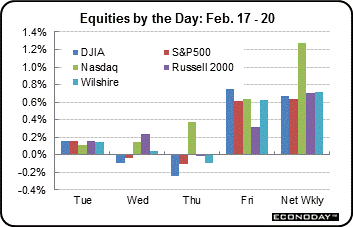 Equity markets in the U.S. were quiet all week until Friday. On Friday, news of an extension of a Greek finance deal lifted stocks notably. Also, it appears that Greece will not be leaving the eurozone. For once in some time, a single event—rather than many—moved equities for the week. In the U.S., markets were closed Monday for Presidents' Day Holiday. Equity markets in the U.S. were quiet all week until Friday. On Friday, news of an extension of a Greek finance deal lifted stocks notably. Also, it appears that Greece will not be leaving the eurozone. For once in some time, a single event—rather than many—moved equities for the week. In the U.S., markets were closed Monday for Presidents' Day Holiday.
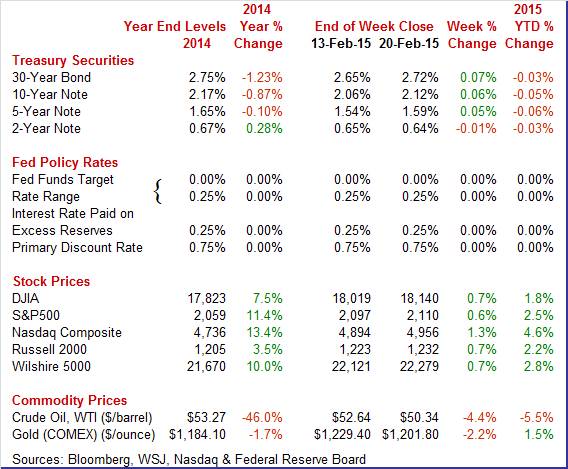
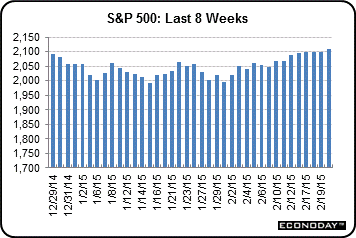 Equities were up this past week. The Dow was up 0.7 percent; the S&P 500, up 0.6 percent; the Nasdaq, up 1.3 percent; the Russell 2000, up 0.7 percent; and the Wilshire 5000, up 0.7 percent. Equities were up this past week. The Dow was up 0.7 percent; the S&P 500, up 0.6 percent; the Nasdaq, up 1.3 percent; the Russell 2000, up 0.7 percent; and the Wilshire 5000, up 0.7 percent.
For the year-to-date, major indexes are up as follows: the Dow, up 1.8 percent; the S&P 500, up 2.5 percent; the Nasdaq, up 4.6 percent; the Russell 2000, up 2.2 percent; and the Wilshire 5000, up 2.2 percent.
Weekly percent change column reflects percent changes for all components except interest rates. Interest rate changes are reflected in simple differences.
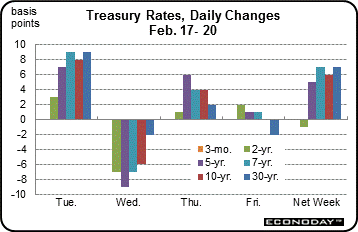 Treasury yields firmed this past week. With a late opening on Tuesday for the week, rates rose moderately on a gain in the dollar as weaker than expected Japanese growth suggested that U.S. growth would lead to higher rates. But yields declined somewhat Wednesday after dovish Fed minutes were released. Rates edged up Thursday on a drop in initial jobless claims and were little changed Friday. Treasury yields firmed this past week. With a late opening on Tuesday for the week, rates rose moderately on a gain in the dollar as weaker than expected Japanese growth suggested that U.S. growth would lead to higher rates. But yields declined somewhat Wednesday after dovish Fed minutes were released. Rates edged up Thursday on a drop in initial jobless claims and were little changed Friday.
For this past week Treasury rates were mostly up as follows: the 5-year note, up 5 basis points; the 7-year note, up 7 basis points; the 10-year note, up 6 basis points; and the 30-year bond, up 7 basis points. The 3-month T-bill was unchanged while the 2-year note slipped 1 basis point.
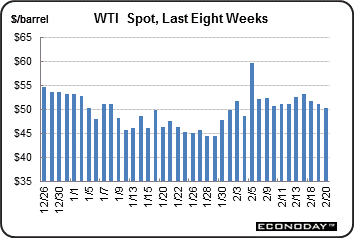 The spot price of crude continued to fall on supply concerns. The spot price of crude continued to fall on supply concerns.
The two biggest daily moves were Wednesday and Friday. The spot price of West Texas Intermediate fell almost $1-1/2 Wednesday on anticipation of the one day delayed (due to the Monday holiday) government report on supply that was expected to hit a record high. Indeed, Thursday's report showed an 80 year high for inventories of crude. Crude slipped Friday somewhat under a dollar a barrel on continued supply worries.
Net for the week, the spot price for West Texas Intermediate declined $2.30 per barrel to settle at $50.34.
The Fed continues loose monetary policy while inflation and wages remain low. The positive is the consumer sector while there is uncertainty about housing and manufacturing.
The latest Fed minutes showed increased debate over timing of the next rate increase. But the doves still dominate.
The Fed minutes for the January FOMC minutes indicated that the Fed still remains "patient" for when the first policy rate increase will occur. While some hawks are worried about rates being raised too late, most on the FOMC remain dovish. Foreign issues remain a notable downside risk and inflation is low. Many participants see an early rate increase as damping the recovery.
Even though energy is currently holding down inflation, inflation is seen as eventually returning to goal of 2 percent. But soft wage growth is a notable concern.
The Fed is getting more technical with staff presentations on unwinding operations regarding the Fed balance sheet. There were discussions regarding interest on excess reserves and on reverse repos. These are relatively new policy rates that have only been experimentally used for practice by the Fed for future tightening.
Overall, the tenor of the minutes clearly was dovish. A first rate hike is not likely before June—and increases are likely to be very gradual.
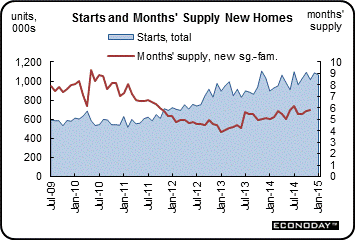 The housing sector is not adding to economic momentum. Housing starts slipped in January on weakness in single-family starts. The housing sector is not adding to economic momentum. Housing starts slipped in January on weakness in single-family starts.
Housing starts declined 2.0 percent in January after a 7.1 percent jump the month before. The 1.065 million unit pace was up 18.7 percent on a year-ago basis.
Single-family starts dropped 6.7 percent after a 7.9 percent boost in December. Multifamily starts gained 7.5 percent, following a 5.6 percent rise in December.
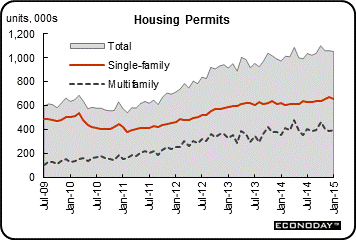 Again, permits suggest that housing activity is muted. Housing permits dipped 0.7 percent, following no change in December. The 1.053 million unit pace was up 8.1 percent on a year-ago basis. The market consensus was for a 1.070 million unit pace. Again, permits suggest that housing activity is muted. Housing permits dipped 0.7 percent, following no change in December. The 1.053 million unit pace was up 8.1 percent on a year-ago basis. The market consensus was for a 1.070 million unit pace.
The bottom line is that housing is not adding to economic activity. This means the Fed likely will continue to reinvest mortgage-backed securities to keep rates low. But the long-term trend appears to be that single-family housing is not viewed as strong of an investment as in the past.
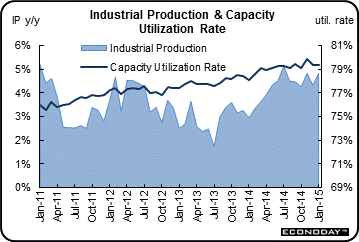
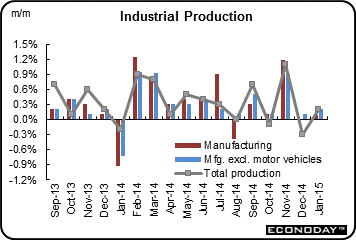 The industrial sector turned modestly positive in January—including for the manufacturing component. But downward revisions stood out. The industrial sector turned modestly positive in January—including for the manufacturing component. But downward revisions stood out.
Industrial production for January rebounded 0.2 percent after a December decrease of 0.3 percent. But January data fell below expectations were for a 0.4 percent boost.
Manufacturing rose 0.2 percent in January after no change the month before. But the negative is that December manufacturing was revised down from a 0.3 percent gain. The manufacturing increase fell short of the 0.4 percent market forecast.
 Production of durable goods advanced 0.4 percent in January while production of nondurable goods was unchanged. Gains were posted by all major durable goods industries except motor vehicles and parts, aerospace and miscellaneous transportation equipment, and furniture and related products. Increases of more than 1.0 percent were recorded in the production of primary metals and of computer and electronic products. Among the major nondurable goods industries, gains in the indexes for apparel and leather, for chemicals, and for plastics and rubber products offset losses elsewhere. The production of other manufacturing industries (publishing and logging) moved down 0.4 percent. Production of durable goods advanced 0.4 percent in January while production of nondurable goods was unchanged. Gains were posted by all major durable goods industries except motor vehicles and parts, aerospace and miscellaneous transportation equipment, and furniture and related products. Increases of more than 1.0 percent were recorded in the production of primary metals and of computer and electronic products. Among the major nondurable goods industries, gains in the indexes for apparel and leather, for chemicals, and for plastics and rubber products offset losses elsewhere. The production of other manufacturing industries (publishing and logging) moved down 0.4 percent.
Mining dropped 1.0 percent in January after a 2.1 percent jump the prior month. Utilities made a partial rebound of 2.3 percent after plunging 6.9 percent in December.
Overall capacity utilization was unchanged at 79.4 percent and is not putting upward pressure on prices—a plus for continued loose Fed policy.
The biggest news from this report was the downward revision to December. Manufacturing is still sluggish although on a barely positive uptrend.
Growth remains steady in Markit's US manufacturing sample where the flash February reading held little changed, at 54.3 vs 53.9 at month-end January and 53.7 at mid-month January. The plus side is led by production volumes, which are at a 4-month high. Dragging on the index are slower growth in employment, the slowest in 7 months, and slower growth in new business, the slowest in 13 months and weighed down especially by weakness in exports and also by weakness among oil & gas customers.
As in other reports, supplier deliveries are lengthening, reflecting not rising business conditions, but snags tied to heavy Northeast weather and the West Coast port slowdown. Also like other reports, both input and output prices are flat.
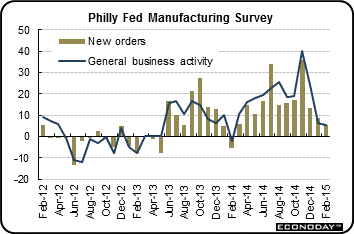
This report echoes the results of this week's Empire State and Philly Fed reports -- no more than moderate growth for manufacturing this month.
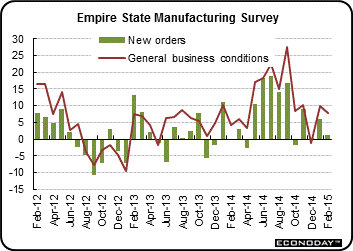 Manufacturers in the New York region reported moderate though slowing growth for February though details show a tangible falloff in confidence for the outlook. February's general conditions index came in at 7.78, only slightly lower than January's 9.95 and right in line with the average over the last 5 months of 7.08. Manufacturers in the New York region reported moderate though slowing growth for February though details show a tangible falloff in confidence for the outlook. February's general conditions index came in at 7.78, only slightly lower than January's 9.95 and right in line with the average over the last 5 months of 7.08.
 Shipments were at a solid 14.12, up from January's 9.59 and the strongest reading since September. But growth in new orders was nearly dead flat, down almost 5 points to 1.22 for the second lowest reading of the last 10 months. And confidence has suddenly slipped with the outlook down more than 20 points to 25.58 for the lowest level in two years. Shipments were at a solid 14.12, up from January's 9.59 and the strongest reading since September. But growth in new orders was nearly dead flat, down almost 5 points to 1.22 for the second lowest reading of the last 10 months. And confidence has suddenly slipped with the outlook down more than 20 points to 25.58 for the lowest level in two years.
Turning to the Philly Fed report, the general conditions index softened modestly to 5.2 versus January's 6.3. But optimism, like the Empire State report, is cooling with the Philly Fed's 6-month outlook falling to 29.7 vs December's 50.9.
The new orders index was a positive, still on the plus side at 5.4 vs January's 8.5. And unfilled orders are a special positive, rising to 7.3 from January's contraction of minus 8.6.
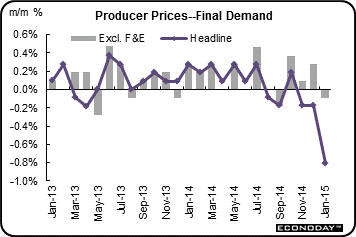 Inflation has not just stopped but has fallen at the headline level due to lower gasoline prices. Inflation has not just stopped but has fallen at the headline level due to lower gasoline prices.
The PPI for total final demand decreased 0.8 percent after falling 0.2 percent in December. This was the biggest drop for the PPI-FD on record.
A sharp drop in energy pulled the headline number down. But weakness was more widespread. Excluding food and energy, producer price inflation slipped 0.1 percent after firming 0.3 percent the month before. Expectations were for a 0.1 percent rise.
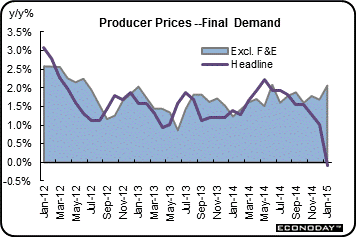 The index for final demand goods fell 2.1 percent after dropping 1.1 percent in December. The January decrease was led by prices for final demand energy, which fell a monthly 10.3 percent. The decline in prices for final demand goods was led by the index for gasoline, which dropped 24.0 percent. The index for final demand goods fell 2.1 percent after dropping 1.1 percent in December. The January decrease was led by prices for final demand energy, which fell a monthly 10.3 percent. The decline in prices for final demand goods was led by the index for gasoline, which dropped 24.0 percent.
The index for final demand services eased 0.2 percent after advancing 0.3 percent in December. In January, prices for final demand services less trade declined 0.3 percent after rising 0.1 percent the month before. This was the first decline since falling 0.3 percent in September 2014. In January, a major contributor to the decline in the index for final demand services was prices for outpatient care (partial), which fell 0.7 percent.
On a seasonally adjusted year-ago basis, PPI final demand was down 0.1 percent, compared to up 1.0 percent in December. Excluding food & energy, PPI final demand was up 1.5 percent versus 1.8 percent the month before.
Overall, inflation at the manufacturers' level is muted even after discounting energy declines. The Fed is likely to see the numbers as allowing delayed rate increases.
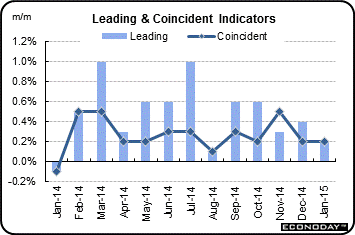 The index of leading economic indicators slowed to a not-so-strong plus 0.2 percent versus a slightly downward revised plus 0.4 percent in December. The index of leading economic indicators slowed to a not-so-strong plus 0.2 percent versus a slightly downward revised plus 0.4 percent in December.
Once again the yield spread was the biggest positive for the index reflecting the Fed's near zero rate policy. But outside rate policy, gains were less than spectacular led by credit indications and also consumer expectations which however may be slipping this month based on the twice-monthly consumer sentiment report.
Consumer sector news was favorable with a drop in initial jobless claims. But housing and industrial production are sluggish. Meanwhile, inflation is low and the Fed appears to be inclined to keep policy rates low.
There is a lot on tap this week and across a variety of sectors. Housing has been waffling and winter months have sizeable seasonal factors. But traders will be watching for news on existing home sales, new home sales, and pending home sales. New price data will post for Case-Shiller and FHFA. Manufacturing also has been soft and the durables report will garner attention. The Fed is balancing the labor market with inflation data. So, this week's CPI report could affect Fed thinking—notably the core trend. Second revision to fourth quarter GDP growth also is posted.
The Chicago Fed National Activity Index for December was weak, at negative 0.05 vs plus 0.92 in November. All four components of the index fell relative to November with two in outright contraction. But the 3-month average remained in the positive column though it did slow, to plus 0.39 from December's plus 0.54.
Chicago Fed National Activity Index Consensus Forecast for January 15: 0.15
Range: -0.20 to 0.50
The Markit PMI services index edged up to 54.2 for the final January reading from 54.0 at mid-month and compared against December's 10-month low of 53.3. Though this index has been slowing from 60-plus peaks mid-year last year, the current rate of growth is respectable and sustainable. A negative was sharp slowing in incoming new work to the slowest rate in the 5-year history of the report. On the plus side was solid growth in employment which underscores upbeat expectations for business growth over the year ahead. On prices, cost pressures were at their lowest since November 2010, the result of low fuel prices, while prices charged were showing only marginal traction.
Markit PMI services index (flash) Consensus Forecast for February 15: 54.2
Range: 53.8 to 55.1
Existing home sales popped up in December as expected, up 2.4 percent to an annual sales rate of 5.04 million versus a revised 6.3 percent decline in November to 4.92 million. December's gain was led by single-family homes which rose 3.5 percent to a 4.47 million rate. Condos declined 5.0 percent in the month to a 570,000 rate. The gain in sales drew down available homes on the market to 1.85 million from 2.08 million, in turn sharply lowering supply on the market to 4.4 months from 5.1 months. Lower supply points to sales troubles in next month's report. On net, this was a solid report though seasonal factors do play an unusually large role in housing readings during the winter.
Existing home sales Consensus Forecast for January 15: 4.950 million-unit rate
Range: 4.850 to 5.200 million-unit rate
The Dallas Fed general business activity index worsened in January with both the general business activity index and the company outlook index dropping below zero for the first time in 20 months. The general business activity index dropped to minus 4.4, and the company outlook index fell 13 points, coming in at minus 3.8. Texas factory activity was flat in January. The production index, a key measure of state manufacturing conditions, came in at 0.7, indicating output was essentially unchanged from December.
Dallas Fed general business activity index Consensus Forecast for February 15: -2.8
Range: -8.0 to 0.5
The S&P/Case-Shiller 20-city home price index (SA) showed some life in November rising 0.7 percent (seasonally adjusted) to match October's revised gain. Gains in the month were led by the largest region for home sales, the South, where Tampa, at plus 1.8 percent, and Atlanta, at plus 1.7 percent, showed particularly strong gains. Gains in the West were also strong led by San Francisco at plus 1.1 percent. Despite the strength in monthly sales, the year-on-year rate edged 2 tenths lower to plus 4.3 percent (both adjusted and unadjusted). This rate has been edging lower each month since November 2013 but the degree of the latest decline is very small and the downward curve is definitely flattening out in what is a positive indication that the comparison may soon begin to turn higher.
The S&P/Case-Shiller 20-city HPI (SA, m/m) Consensus Forecast for December 14: +0.5 percent
Range: +0.4 to +0.8 percent
The S&P/Case-Shiller 20-city HPI (NSA, m/m) Consensus Forecast for December 14: -0.1 percent
Range: -0.3 to 0.0 percent
The S&P/Case-Shiller 20-city HPI (NSA, y/y) Consensus Forecast for December 14: +4.2 percent
Range: +4.1 to +4.5 percent
The Conference Board's consumer confidence index was up very sharply in a January reading and recovery best of 102.9 that was outside the Econoday forecast range (93.5 to 100.0). Gains swept most readings including a 12.7 point surge in the present situation component to 112.6. Here, the jobs-hard-to-get subcomponent showed special strength, down 1.6 percentage points to 25.7 percent in a reading that proved to be a positive indication for January's employment report. The expectations component also showed strength, up 7.9 points to 96.4 with the income subcomponent up sharply. Strength in expectations for future income points to a combination of strength in the jobs market, the stock market, and also the positive effect of lower gasoline prices.
Consumer confidence Consensus Forecast for February 15: 99.1
Range: 95.0 to 109.0
The Richmond Fed manufacturing index slipped 1 point in January to plus 6. Growth in new orders, at 4, was steady but moderate while the draw in backlog orders picked up, to minus 9 from minus 5. Production, fed by the working down in backlogs, actually accelerated 5 points in the month to plus 10 but this pace can't be sustained unless new orders pick up.
Richmond Fed manufacturing index Consensus Forecast for February 15: 6
Range: 4 to 8
New home sales surged 11.6 percent in December to a 481,000 annual rate that was outside the top estimate of the Econoday forecast (445,000 to 470,000). This followed a 6.7 percent drop in November. Though there were 2.3 percent more homes on the market in December, totaling 219,000, the gain in sales drew down supply relative to sales to 5.5 months from 6.0 months in November.
New home sales Consensus Forecast for January 15: 471 thousand-unit annual rate
Range: 440 thousand to 495 thousand-unit annual rate
The consumer price index fell another 0.4 percent in December after falling 0.3 percent November. The December figure matched market expectations for a 0.4 percent drop and was the largest decrease since 2008. Energy plunged 4.7 percent after dropping 3.8 percent in November. Gasoline dropped a huge 9.4 percent, following a plunge of 6.6 percent in November. Food, however, gained 0.3 percent, following a rise of 0.2 percent in the previous month. Excluding food and energy, consumer price inflation slowed to unchanged after a modest 0.1 percent in rise November. Analysts projected a 0.1 percent gain.
Within the core, the shelter index continued to rise (up 0.2 percent), and the index for medical care posted its largest increase (up 0.5 percent) since August 2013. However, these increases were offset by declines in a broad array of indexes including apparel, airline fares, used cars and trucks, household furnishings and operations, and new vehicles.
On a seasonally adjusted basis, the headline CPI was up year-ago 0.7 percent versus 1.3 percent in November. Excluding food and energy, the year-ago rate was 1.6 percent, compared to 1.7 percent the previous month.
CPI Consensus Forecast for January 15: -0.6 percent
Range: -0.8 to -0.2 percent
CPI ex food & energy Consensus Forecast for January 15: +0.1 percent
Range: +0.1 to +0.2 percent
Durable goods orders unexpectedly fell 3.3 percent in December after dropping 2.2 percent in November. Excluding transportation, the core slipped 0.8 in December following a decline of 1.3 percent in November. Transportation plunged a monthly 9.1 percent after dropping 4.0 percent in November. Outside of transportation, weakness was mixed.
Numbers reflect revisions from the more recent total factory orders report.
New orders for durable goods Consensus Forecast for January 15: +2.0 percent
Range: -2.1 percent to +4.0 percent
New orders for durable goods, ex-trans., Consensus Forecast for January 15: +0.7 percent
Range: -0.5 percent to +1.1 percent
Initial jobless claims fell a sizable 21,000 in the February 14 week to a slightly lower-than-expected 283,000, nearly reversing a 25,000 spike in the prior week. Volatility in weekly data puts importance on the 4-week average which was down for a 4th straight week, 6,500 lower to 283,250 for the lowest level since early November. Importantly, the February 14th week was the sample week for the monthly employment report and comparisons with the January sample week show significant improvement, down 26,000 for the level itself and down a very sizable 23,750 for the 4-week average.
Jobless Claims Consensus Forecast for 2/21/15: 290,000
Range: 279,000 to 300,000
The FHFA purchase only house price index gained 0.8 percent in November, following a 0.4 percent rise the month before. Market expectations were for a 0.3 percent increase for November. The year-ago rate posted at 5.3 percent from 4.4 percent in October.
FHFA purchase only house price index Consensus Forecast for December 14: +0.5 percent
Range: +0.4 to +1.0 percent
The Kansas City Fed manufacturing index expanded at a slower pace in January, but producers' expectations for future activity remained at solid levels. Most price indexes were lower than last month, especially for finished goods prices. The month-over-month composite index was 3 in January, down from 8 in December and 6 in November. The composite index is an average of the production, new orders, employment, supplier delivery time, and raw materials inventory indexes. Most other month-over-month indexes were also down compared to last month. The production, shipments, and new orders indexes moved into negative territory for the first time in over a year, and the employment index posted a five-month low. The order backlog index plunged from 5 to -20, and the new orders for exports index decreased from 0 to -7. The finished goods inventory index continued to rise somewhat, and the raw materials inventory index moved up from 7 to 12.
Kansas City Fed manufacturing index Consensus Forecast for February 15: 3
Range: 3 to 5
The advance GDP growth estimate for fourth quarter GDP growth disappointed with a 2.6 percent figure versus analysts' estimate of 3.2 percent and following 5.0 percent for the third quarter. Final sales of domestic product slowed to 1.8 percent, following a 5.0 percent jump in the third quarter. Final sales to domestic purchasers eased to 2.8 percent from 4.1 percent in the third quarter. On the price front, the chain-weighted price index was unchanged, compared to the1.4 percent rise in the third quarter. he core chain index, excluding food and energy, eased to 0.7 percent from 1.7 percent in the third quarter.
Real GDP Consensus Forecast for second estimate Q4 14: +2.1 percent annual rate
Range: +1.7 to +2.4 percent annual rate
GDP price index Consensus Forecast for second estimate Q4 14: 0.0 percent annual rate
Range: 0.0 to 0.0 percent annual rate
The Chicago PMI rose to a January reading of 59.4 versus a revised 58.8 in December. Growth in new orders and growth in production both turned higher while, in a convincing sign of strength, businesses in the area picked up hiring to the highest rate since November 2013. Price data show the lowest level of pressure in 4-1/2 years. This report covers both the manufacturing and non-manufacturing sectors and typically runs hot relative to other data.
Chicago PMI Consensus Forecast for February 15: 58.7
Range: 55.5 to 59.6
The University of Michigan's consumer sentiment index remains very strong but it did move down after spiking in January, to 93.6 for the mid-month February reading versus January's 98.1 which was the best reading in 11 years. The 93.6 reading was still very solid, matching December's reading as the second best of the last 8 years.
Consumer sentiment Consensus Forecast for final February 15: 94.0
Range: 89.5 to 95.0
The pending home sales index fell a very steep 3.7 percent in December after rising 0.6 percent the month before. A decline was not expected at all with the result far underneath the Econoday low estimate for plus 0.3 percent. All regions showed single digit declines in the month including the two most closely watched regions, the South (down 2.6 percent) and the West (down 4.6 percent).
Pending home sales Consensus Forecast for January 15: +2.0 percent
Range: 0.0 to +6.0 percent
He can be found on a weekly broadcast talking about the U.S. economy, the easiest way to find him is by going to iTunes and searching for "Simply Economics."
Econoday Senior Writer Mark Pender contributed to this article.
|
